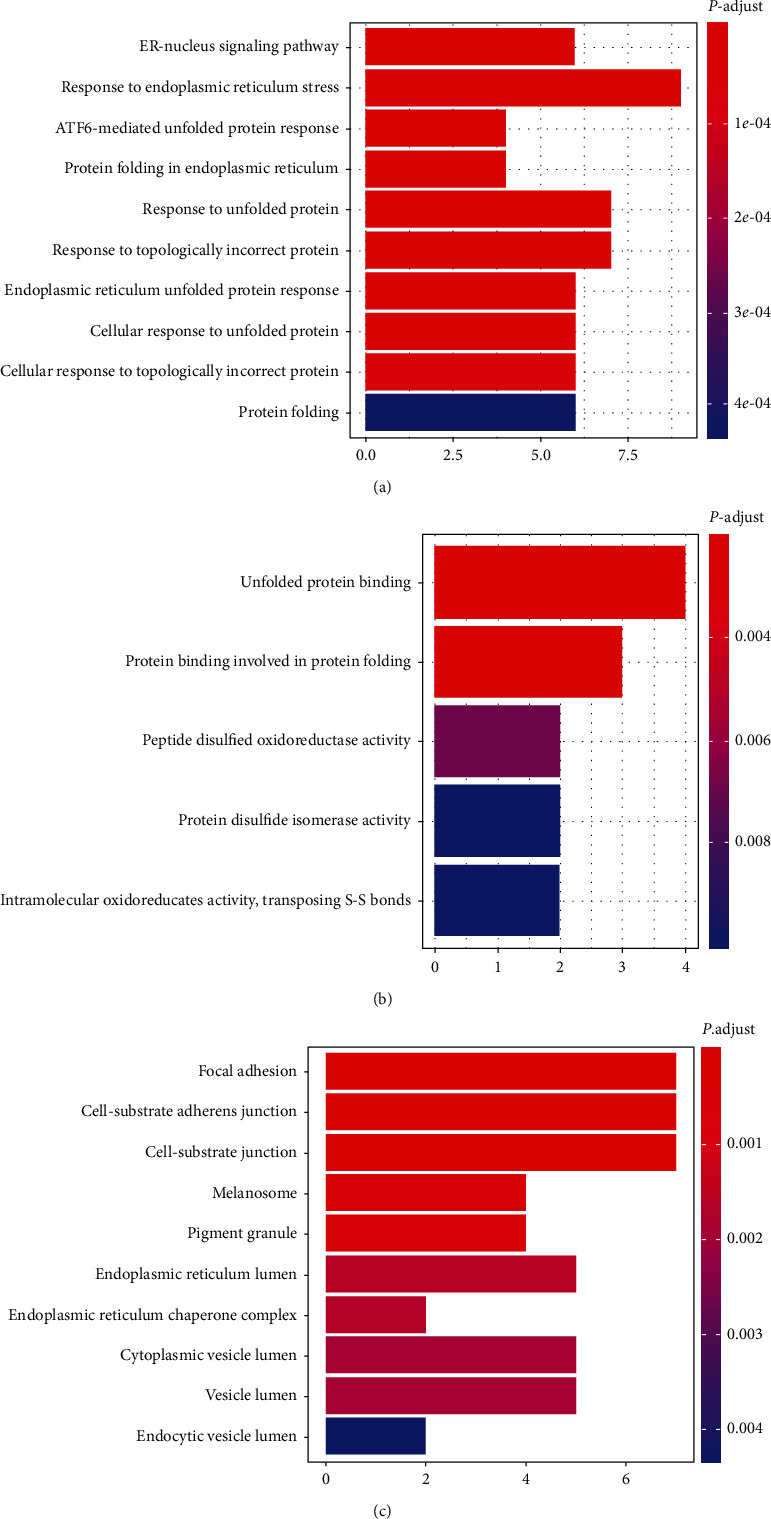
Figure 2.

The Gene Ontology term enrichment of DEGs between deficient/adequate concentrations of FA: (a) biological processes of Gene Ontology terms; (b) molecular functions of Gene Ontology terms; (c) cellular components of Gene Ontology terms. The horizontal axis refers to the number of genes in functional analysis, while the vertical axis represents GO term categories. The colors range from blue to red, representing the change in value threshold of identified significantly enriched GO terms (p. adjust<0.05) from low to high.
