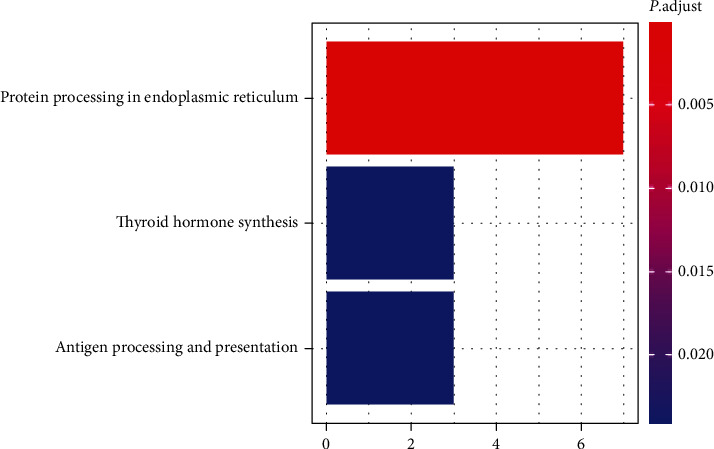
Figure 3.

The KEGG analysis of DEGs between deficient/adequate concentrations of FA. The horizontal axis corresponds to the number of annotated differentially expressed genes in pathway analysis, and the vertical axis represents KEGG pathway categories. The colors of each bar represent the value threshold of identified significantly enriched pathways (p. adjust<0.05).
