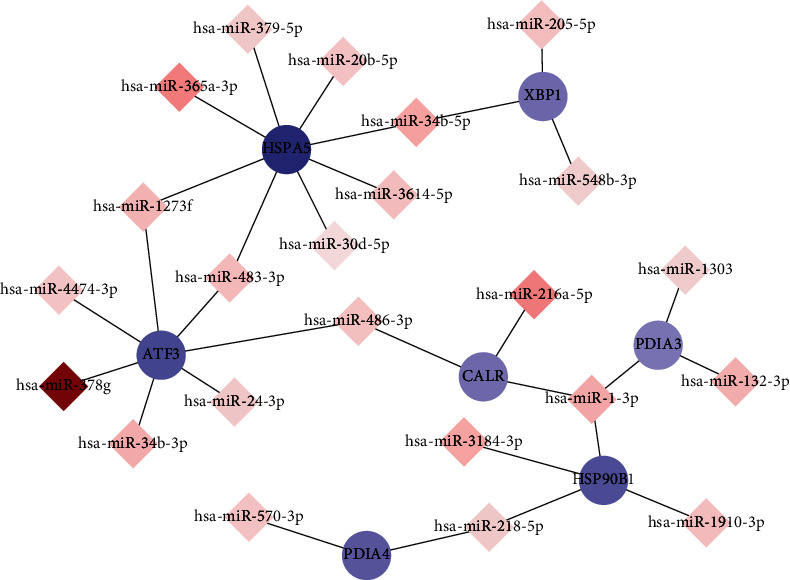
Figure 6.

Interaction network between upregulated miRNAs and downregulated mRNAs in FA deficiency affecting CRC cells. Circular nodes represented mRNAs, and diamond nodes expressed miRNAs. Red and blue colors represented upregulation and downregulation, respectively. The darker of the color represents the more significant up/down fold change. Solid lines indicated interaction associations between miRNAs and mRNAs.
