
Figure 7.
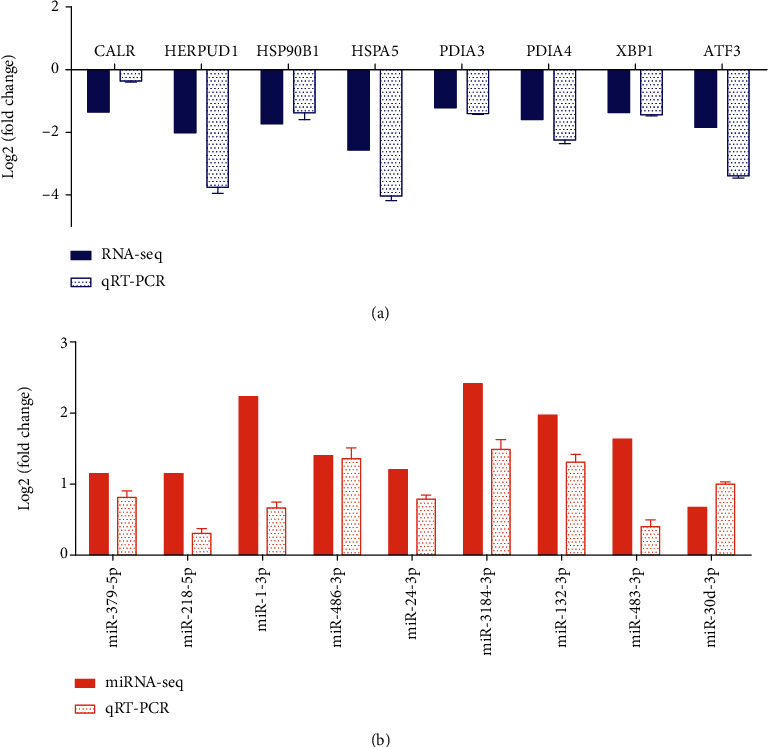
Comparison of the high-throughput sequencing data and RT-qPCR result of HCT116 in FA deficiency: (a) mRNAs; (b) miRNAs. The height of the columns in the chart represents the log-transformed average fold change (deficient FA/adequate FA). All coupled columns between sequencing data and RT-qPCR result have the statistical significance (p < 0.05). Bars represent standard errors.