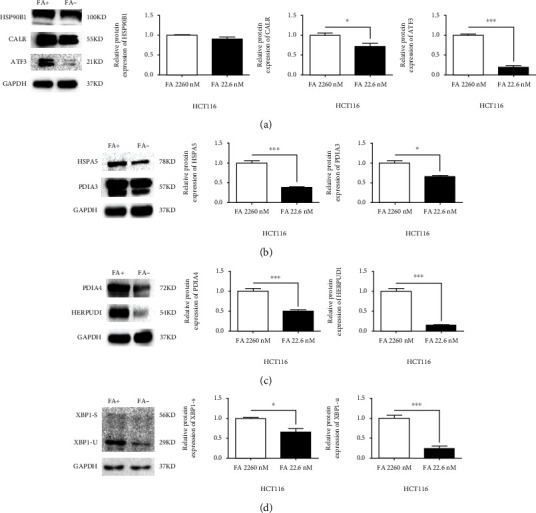
Figure 8.

FA deficiency affects the expressions of ER stress associated proteins in HCT116: (a) the expressions of HSP90B1, CALR, and ATF3; (b) the expressions of HSPA5 and PDIA3; (c) the expressions of PDIA4 and HERPUD1; (d) the expressions of XBP1-s and XBP1-u. ∗∗∗p < 0.001, ∗p < 0.05. FA+: FA 2260 nmol/L; FA−: FA 22.6 nmol/L; nM: nmol/L. Bars represent standard errors.
