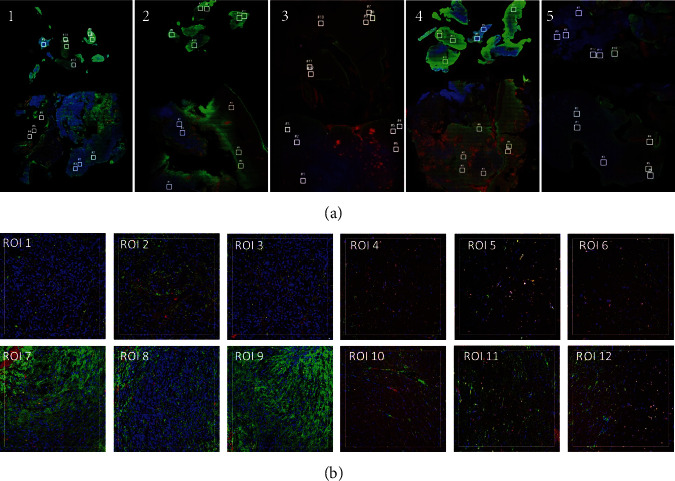
Figure 2.

(a) Photomicrographs of selected cases of glioblastoma (1–5). Each slide had a total of 12 regions of interest (ROIs) selected, denoted by white square: ROIs 1–3 (tumour-MGMT unmethylated), ROIs 4–6 (margin-MGMT unmethylated), ROIs 7–9 (tumour-MGMT methylated), and ROIs 10–12 (margin-MGMT methylated). (b) Close-up of regions of interest 1–12 selected on slide 1. The sections were stained with the visualization markers CD3 (red), GFAP (green), and DNA (blue). ERCC normalised data is shown below.
