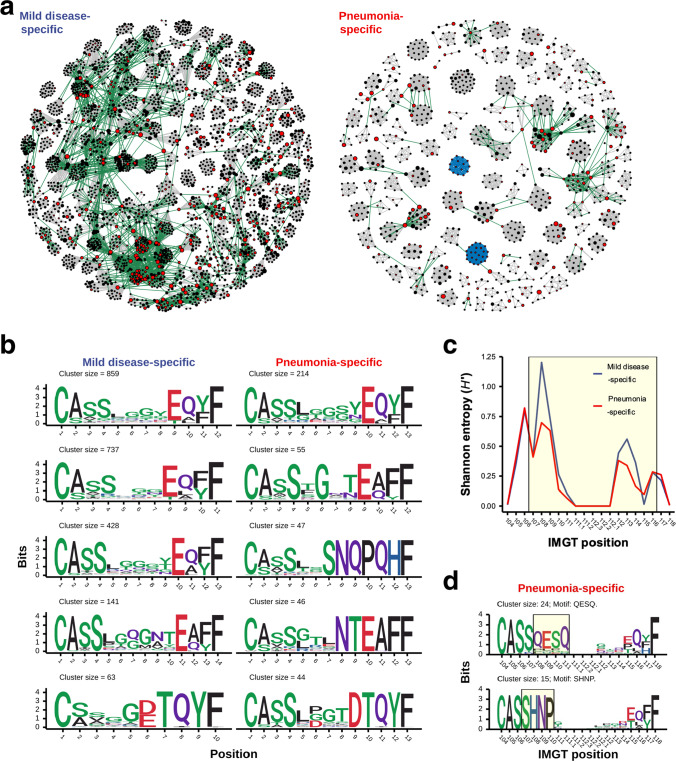
Fig. 4.
The similarity network and CDR3 sequence conservation of TCRβ clonotypes of public SARS-CoV-2-associated mild disease- and pneumonia-specific clusters. a Network graphs illustrated similarities between TCRβ clonotypes from SARS-CoV-2-associated mild disease- (left panel) and pneumonia-specific (right panel) clusters with high level of sharing. Each vertex indicated a TCRβ clonotype with unique CDR3 amino acid sequence. Edges represented high similarities between TCRβ clonotype based on global- (grey line) and motif-based (blue line) clustering by GLIPH2 algorithm as well as calculated small hamming distance (equal to one) between cross-cluster clonotypes with same CDR3 sequence length (green line). Vertex size indicated the frequency of clonotypes among all patients. SARS-CoV-2-annotated TCRβ clonotypes were colored by red. b Logo plots illustrated CDR3 amino acid sequences of top 5 largest SARS-CoV-2-associated mild disease- (left panel) and pneumonia-specific (right panel) TCRβ clusters from single and merged cross-group GLIPH2 global-based TCRβ clusters in (a). c The mean of Shannon entropy of each CDR3 amino acid position among all public SARS-CoV-2-associated mild disease- (blue line) and pneumonia-specific (red line) GLIPH2 global-based TCRβ clusters were shown. The CDR3 region with high structural contact probabilities (107–116) was highlighted by the yellow box. d Sequence logos of annotated TCRβ clonotypes from SARS-CoV-2-associated pneumonia-specific GLIPH2 motif-based TCRβ clusters in (a) were shown. The label on x-axis represented positions of CDR3 amino acid defined by IMGT. The consensus region of enriched motif sequence in each motif-based TCRβ cluster was highlighted by the yellow box

