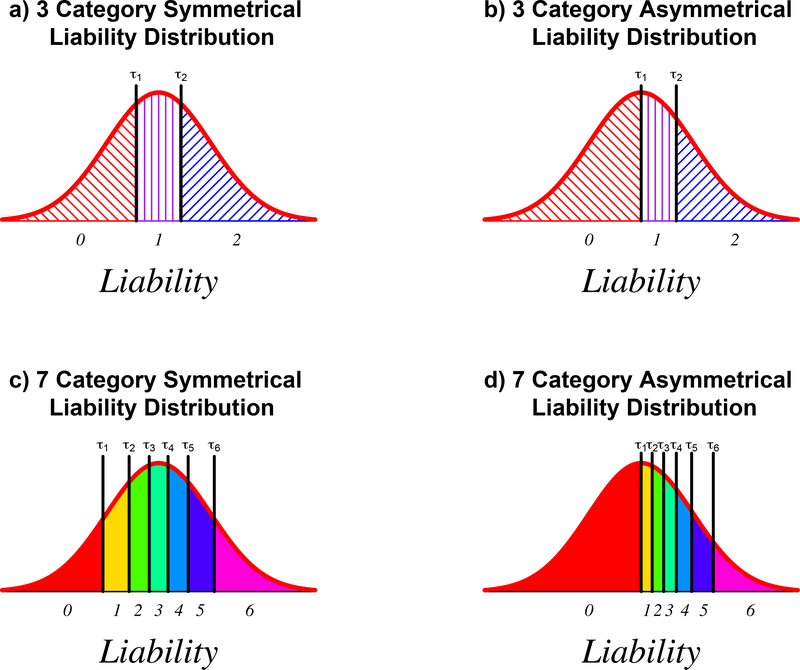
Figure 1.
Threshold models illustrating (upper row) symmetric and asymmetric threshold placements which divide the distribution into equal thirds (left panel) or one-half and two fourths (right panel). The lower two figures show threshold placements for a symmetric (left panel), and asymmetric (right panel) seven-category ordinal variable (left panel). In the symmetric case, the same proportion of individuals fall into each category. For the asymmetric liability, one-half of the distribution falls below the first threshold, and the remainder are divided into six equiprobable ranges. Digits below the x-axis indicate the ordered category number or “score” for that region of the distribution. Note: τ1 and τ2 denote the two thresholds in the trinary case, and τ1 - τ6 the first and last threshold in the 7-ordered-category case.

