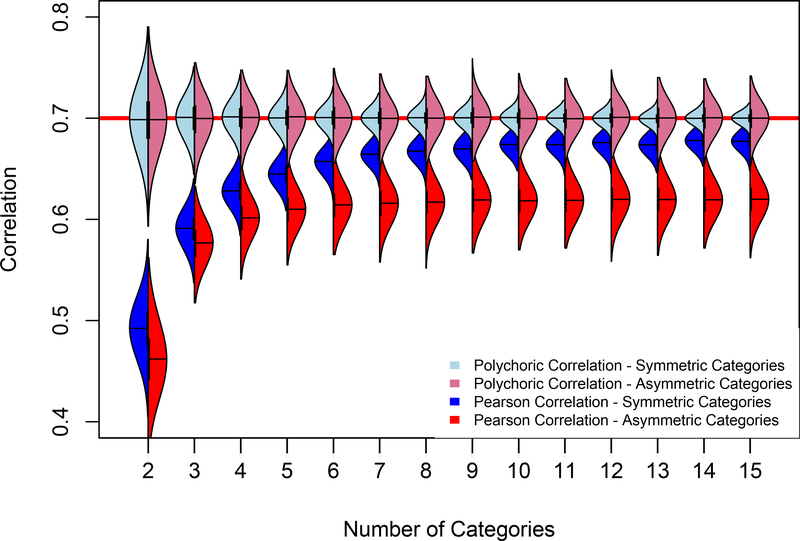
Figure 2.
Violin plots of the distributions of estimated polychoric and Pearson product-moment correlations as a function of the number and patterning of ordinal categories. Light blue and light red densities present the estimated polychoric correlations and the dark blue and dark red densities depict the Pearson product-moment correlations for the evenly-spaced and skewed ordinal categories, respectively. The red line at r = .7 represents the simulated correlation. For the skewed categories, the first threshold was set at the median, and the subsequent categories were evenly spaced along the remainder of the distribution. In the two group condition, the threshold was set at a prevalence of .25.

