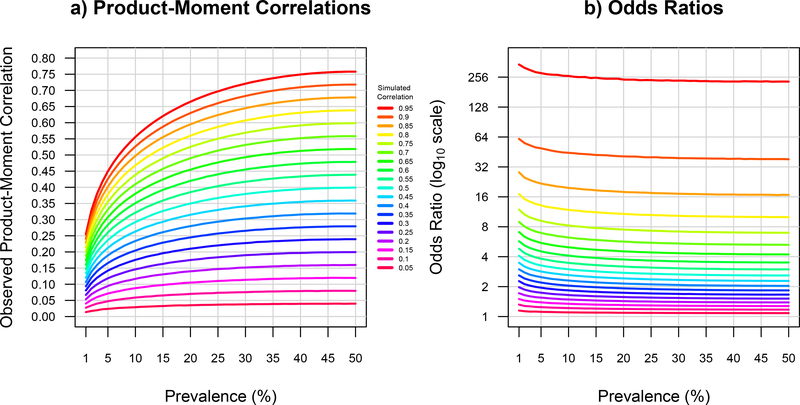
Figure 3.
A graphical presentation of the estimated Pearson product-moment correlations and odds ratios between continuous and binary variables as a function of the prevalence of the binary variables decreases. Panel a) depicts the downward bias of the mean estimated product-moment correlations between a continuous and binary variable for simulated correlations ranging from r = 0.05 through r = 0.95 as the prevalence of the binary trait increases from 0.01 to 0.50. Panel b) depicts the mean estimated odds ratio on a log10 scale for the same data as the simulated correlations ranging from r = 0.05 through r = 0.95 as the prevalence of the binary trait increases from 0.01 to 0.50.

