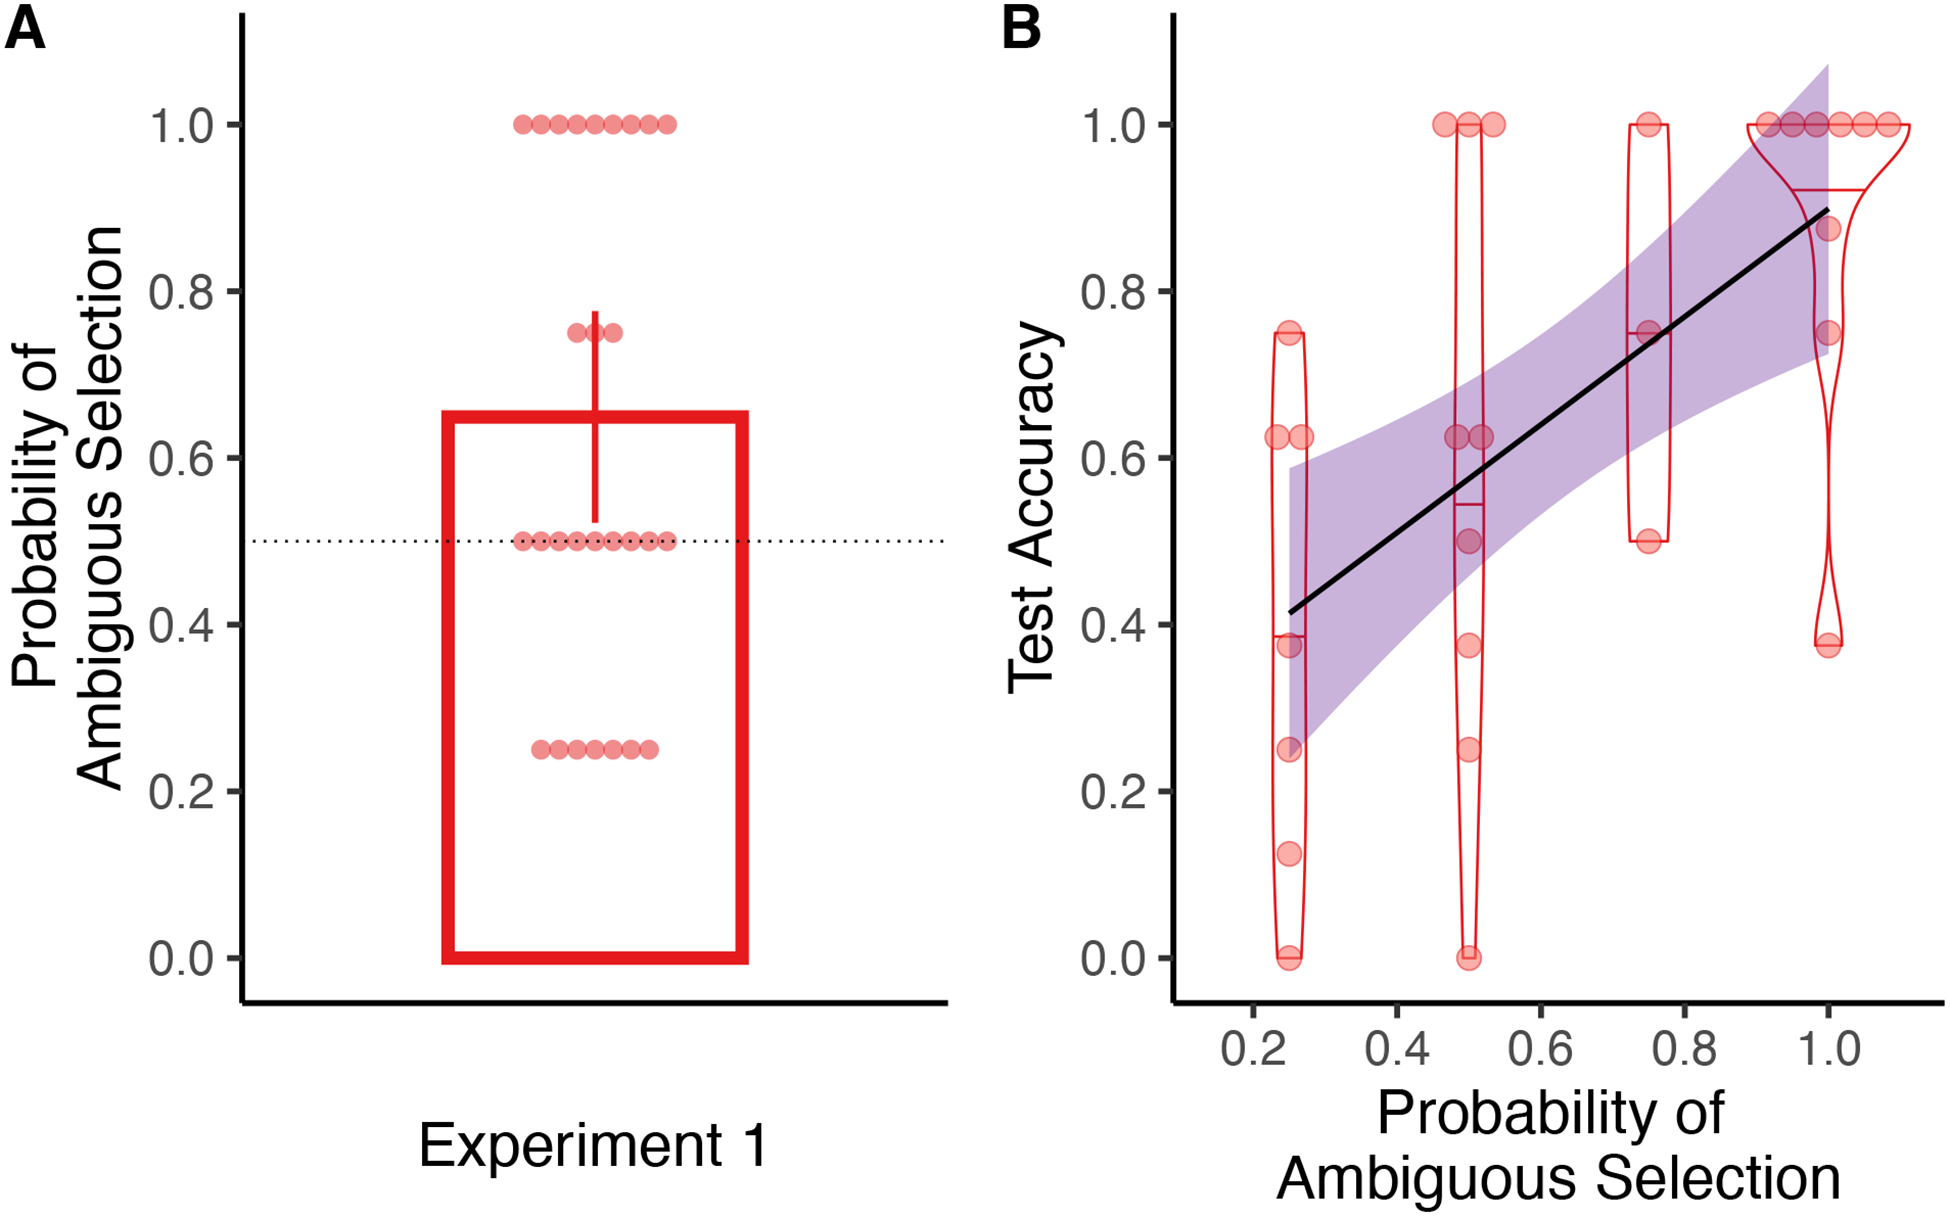
Figure 3.

(A) Proportion of more ambiguous items selected in Experiment 1. Error bar represents the 95% CI of the model predictions. (B) Relationship between choosing more ambiguous items and test accuracy in Experiment. Dots and violin plots represent the distribution of individual participants’ test accuracy. Error bands represent 95% CIs.
