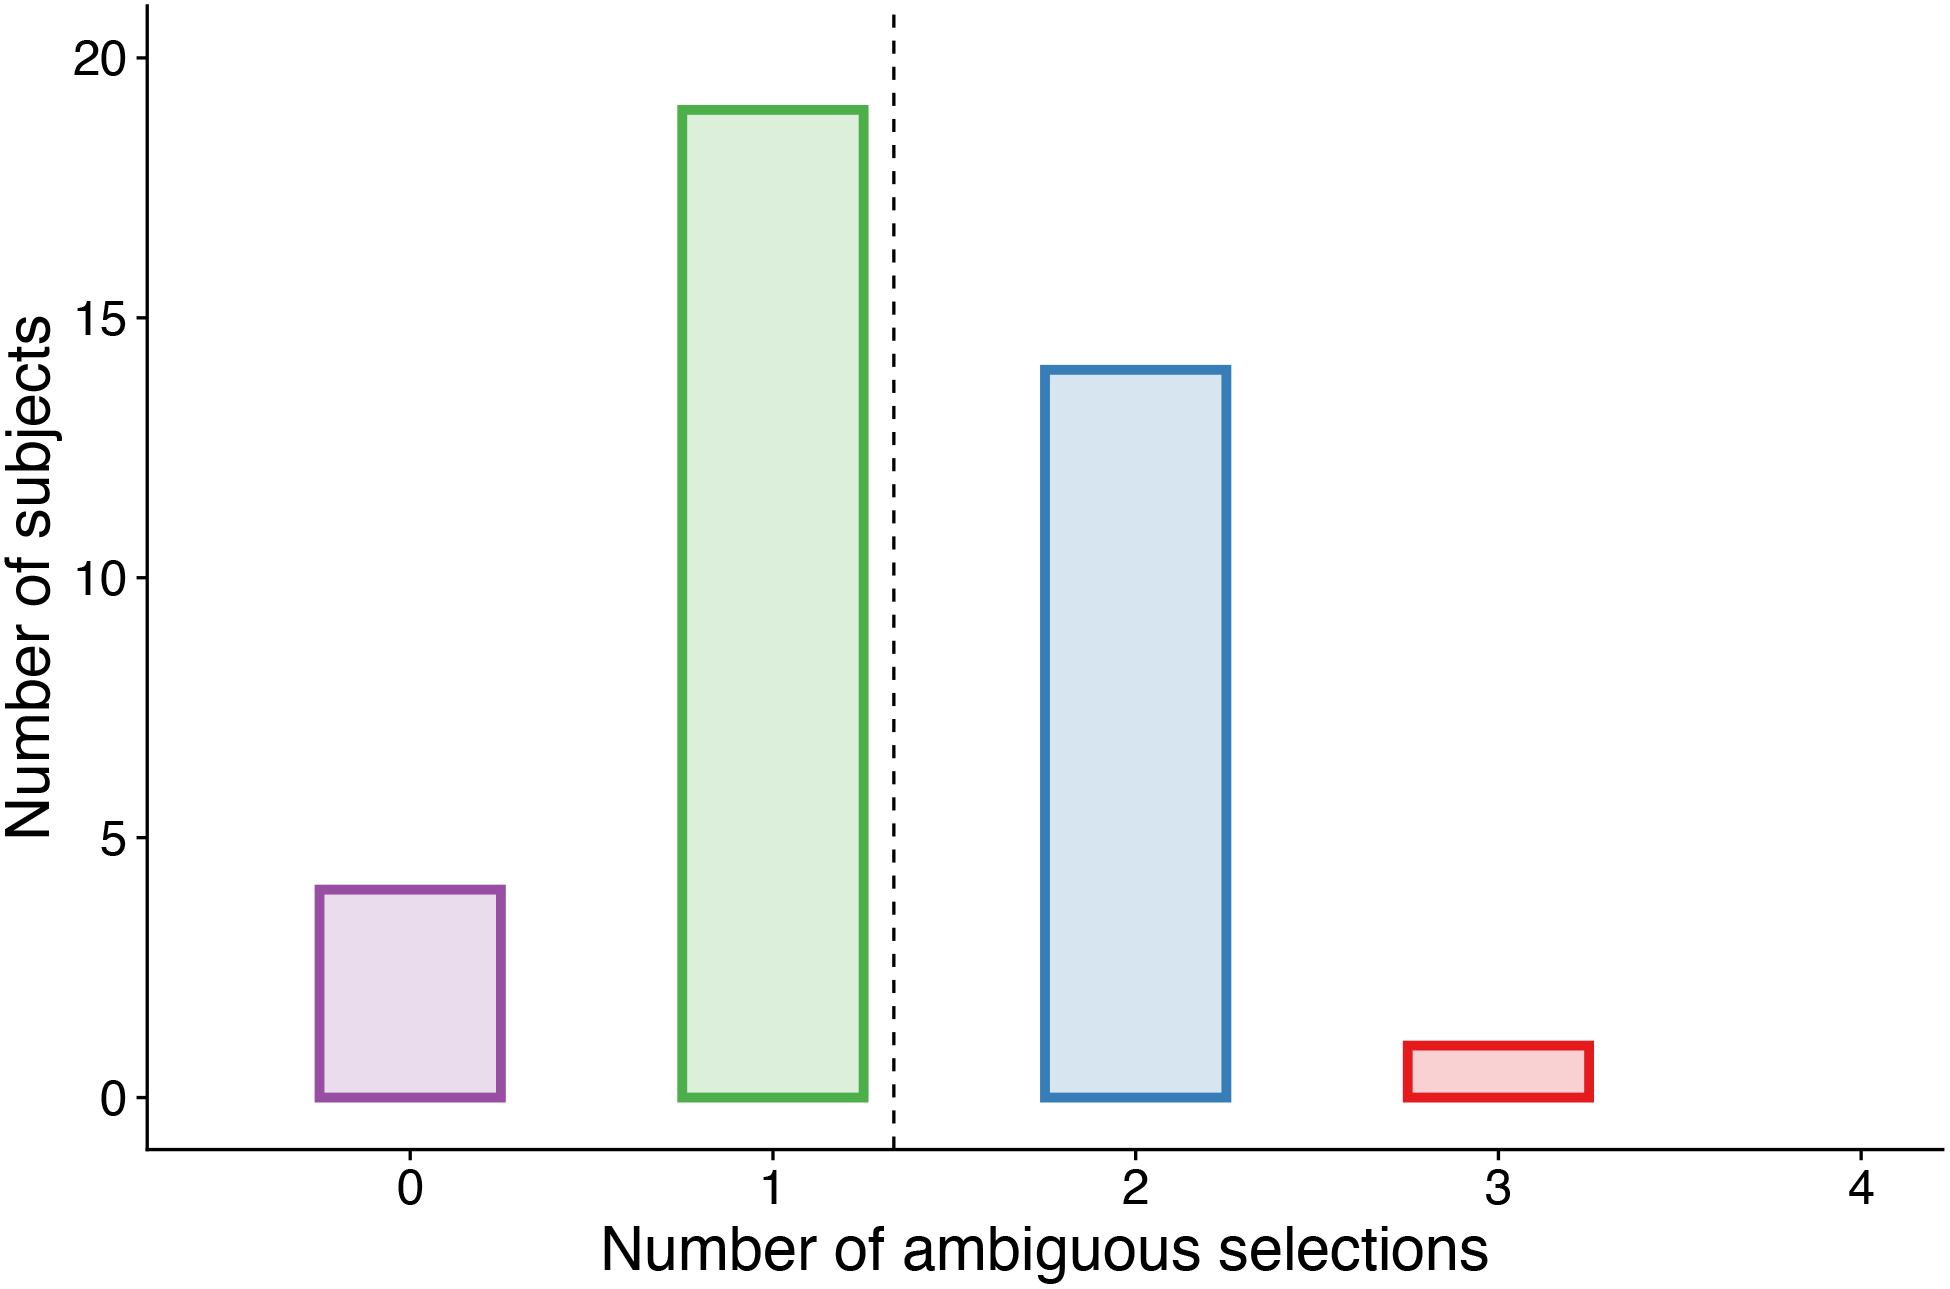
Figure 5.

Children’s sampling choices in Experiment 2. The plot depicts the number of subjects (out of 38) selecting 0, 1, 2, 3, or 4 ambiguous items across the four sampling trials. The dashed line represents the expected value if items are sampled randomly.
