
Fig. 2.
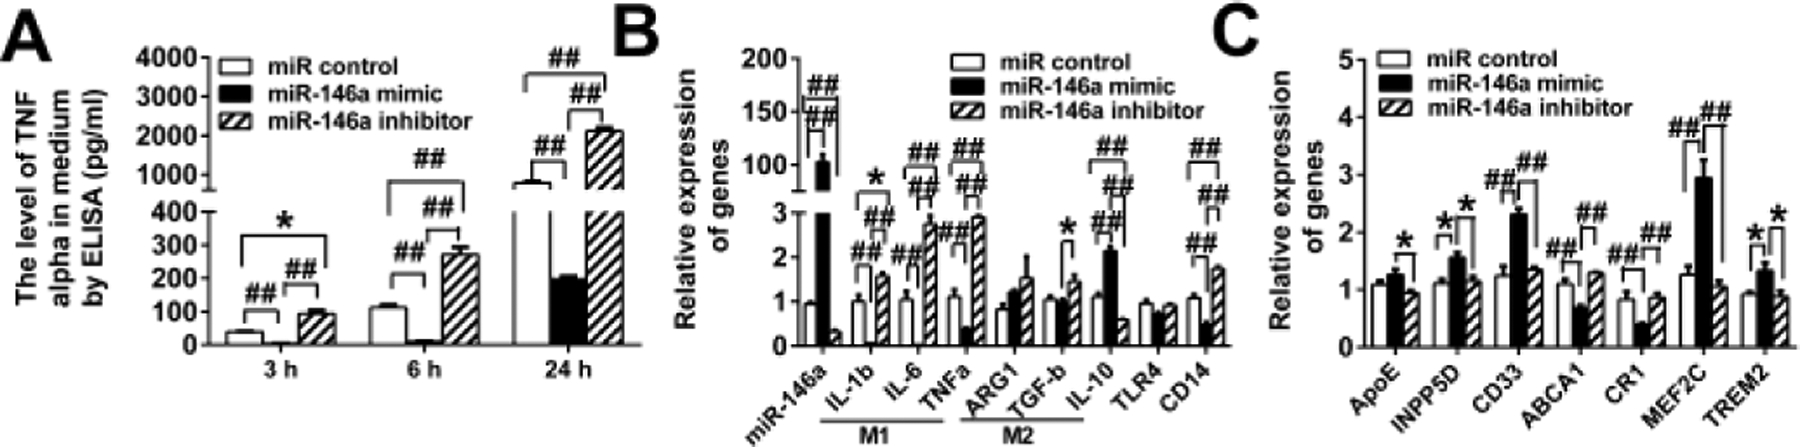
MiR-146a regulates TLR signaling, microglial M1 and M2 phenotypes and AD risk gene expression in BV2 microglia. BV2 cells transfected with miR-negative control, miR-146a mimic, or miR-146a inhibitor were treated with LPS. MiR-146a mimic decreases and its inhibitor increases TNF-α in the BV2 cell media compared to miR control at the indicated time points after LPS treatment (A). MiR-146a mimic and its inhibitor increases and decreases expression levels of miR-146a, respectively (B, column at the extremely left). In response to LPS treatment, miR-146a mimic and its inhibitor shift BV2 cells toward an M2 and M1 phenotype, respectively (B). MiR-146a mimic increases INPP5D, CD33, MEF2C and TREM2 and decreases ABCA1 and CR1 expression compared to miR control (C). MiR-146a inhibitor revokes such expression changes (C). *P < 0.05 and ##P < 0.001.