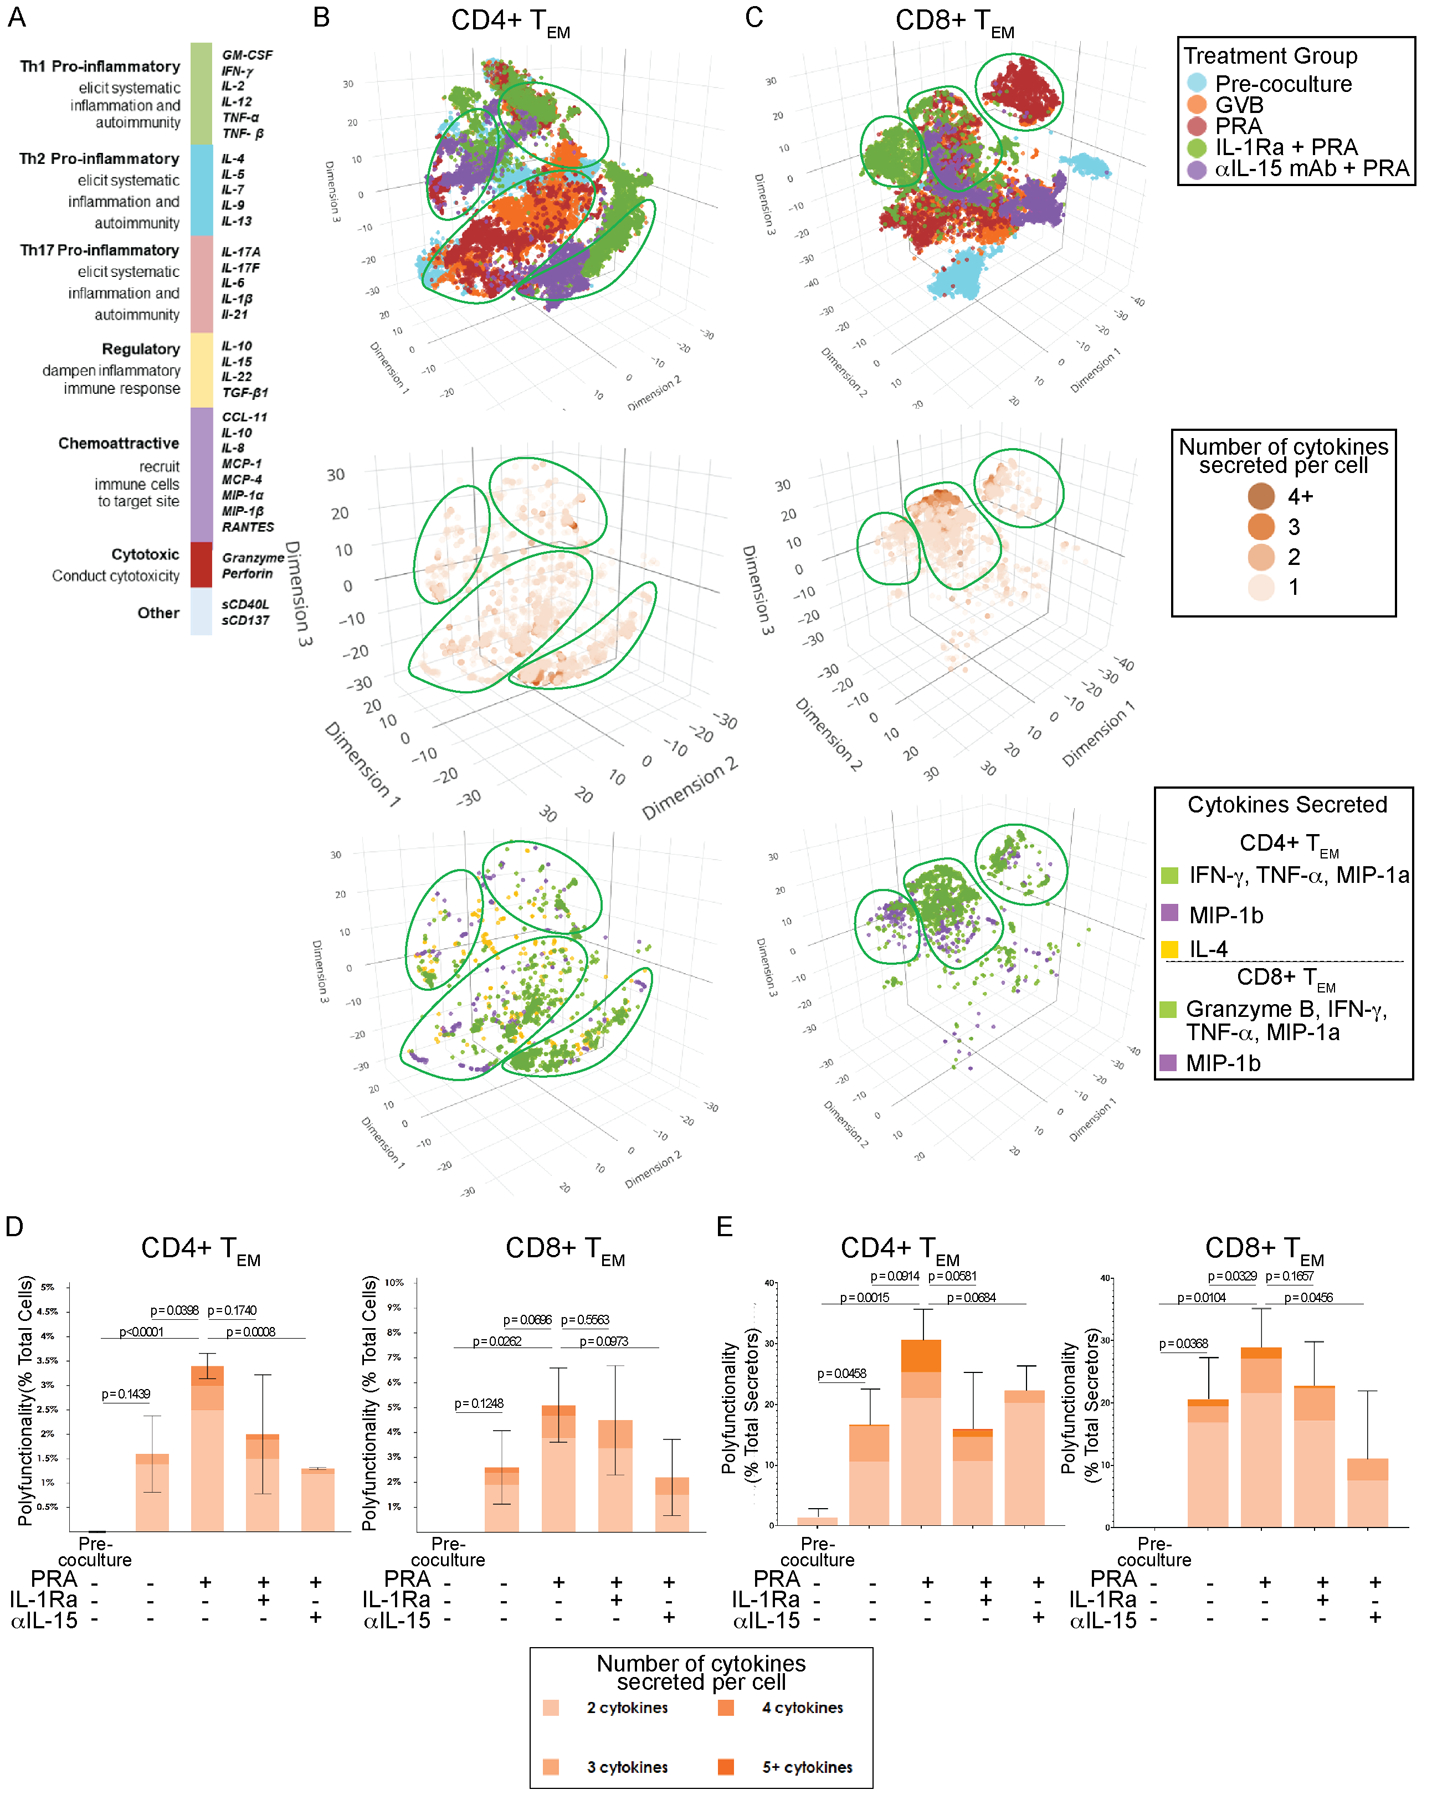
Figure 2. Several distinct clusters of highly polyfunctional allogeneic CD4+ and CD8+ TEM subsets appear in response to PRA-treated ECs identified at single-cell resolution.

A) The cytokine secretion profiles of the proliferated allogeneic CD4+CCR7-CFSElo and CD8+CCR7-CFSElo TEM were assessed separately using IsoPlexis single-cell microchip proteomics platform. Each responding T cell was analyzed for true protein secretions across a broad validated 32-plex cytokine and chemokine panel includes immune functional groups Th1, Th2, Th17, regulatory, chemoattractive and cytotoxic. B) t-distributed stochastic neighbor embedding (t-SNE) visualization of CD4+ TEM responders activated by co-culture with allogeneic human ECs pre-treated with IL-1 Receptor antagonist (IL-1Ra), anti-IL-15 blocking antibody (αIL-15 mAb) or control prior to PRA sera or vehicle treatment. Purified CD4+ TEM that were not co-cultured with ECs were also profiled (“pre-coculture”). Polyfunctional T cell subsets, defined as secretors capable of coproducing at least two cytokines, and the cytokines secreted are identified at single cell resolution. Non-secretors were cells that did not secrete detectable levels of cytokine. Distinct clusters of highly polyfunctional T cell subsets are outlined. Data shown from 4 independent experiments using 4 different PBMC and 4 allogeneic HUVEC donors. C) t-SNE visualization of CD8+ TEM responder polyfunctional and functional cytokine subsets. CD8+ TEM that were not co-cultured with allogeneic human ECs were also profiled (“pre-coculture”). Data shown from 4 independent experiments using 4 different PBMC and 4 allogeneic HUVEC donors. D) The percent polyfunctionality of the total number of cells for each treatment group was calculated as the number of polyfunctional CD4+ or CD8+ TEM cells (≥2 cytokines secreted) out of the total number of cells, which also includes single-secretors and non-secretors. Graphs show data from 4 independent experiments using 4 different PBMC and 4 allogeneic HUVEC donors (mean ± SEM, unpaired 2-tailed Student’s t-test). E) The percent polyfunctionality of the total secretors for each group was calculated as the number of polyfunctional CD4+ or CD8+ TEM cells out of the total number of secretors (≥1 cytokine secreted). t-SNE visualizations and graphs show data from 4 independent experiments using 4 different PBMC and 4 allogeneic HUVEC donors (mean ± SEM, unpaired 2-tailed Student’s t-test).
