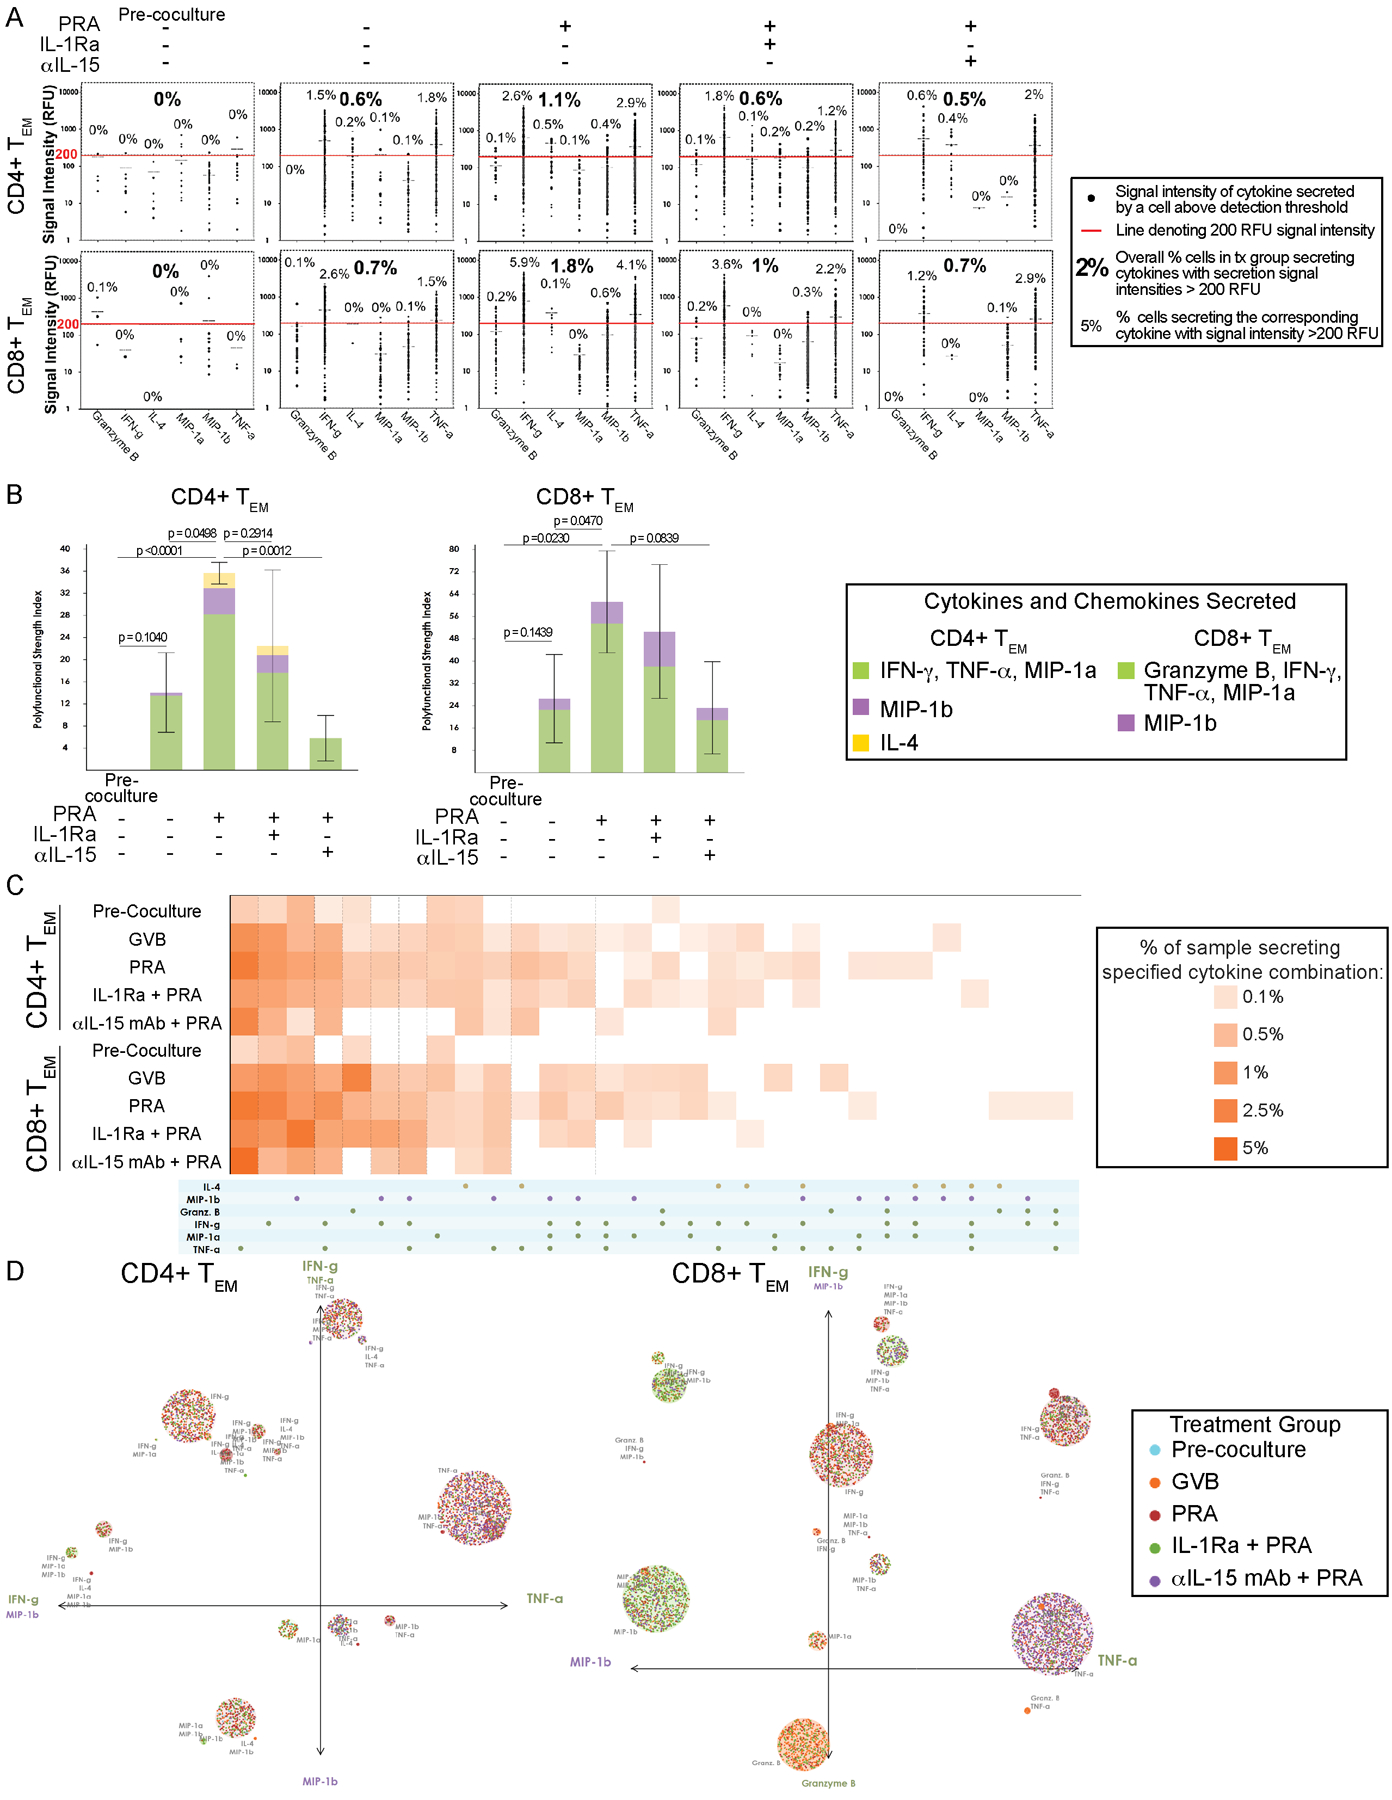
Figure 3. Proliferated TEM triggered by PRA-activated ECs have enhanced and distinct cytokines combinations leading to greater functional heterogeneity and polyfunctional cell subsets.

A) Single-cell cytokine signal distribution of CD4+ and CD8+ TEM activated by co-culture with allogeneic human ECs pre-treated with IL-1 Receptor antagonist (IL-1Ra), anti-IL-15 blocking antibody (αIL-15 mAb) or control prior to PRA sera or vehicle treatment. Each dot indicates the signal intensity of the cytokine that is secreted by the single T cells in the sample above the detection threshold. The overall percentage of cells with secretion signal intensities above 200 RFU is indicated for each treatment group in bolded text. For each cytokine detected, the percentage of cells secreting the corresponding cytokine at intensities greater than 200 RFU is indicated in unbolded text. Data shown from 4 independent experiments using 4 different PBMC and 4 allogeneic HUVEC donors. B) The polyfunctional strength index (PSI), defined as the percentage of polyfunctional T cells (≥2 cytokines secreted) in the sample multiplied by the mean fluorescence signal intensity of the proteins secreted by those cells, and each cytokines’ contribution to the PSI are visualized. Graphs show data from 4 independent experiments using 4 different PBMC and 4 allogeneic HUVEC donors (mean ± SEM, unpaired 2-tailed Student’s t-test, SEM). C) The various combinatorial cytokine secretions and corresponding percentage of CD4+ or CD8+ TEM responders in each the sample secreting the specified cytokine combinations are visualized by polyfunctional heatmap. Data shown from 4 independent experiments using 4 different PBMC and 4 allogeneic HUVEC donors. D) The polyfunctional subsets of the responder CD4+ and CD8+ TEM driving are visualized by single-cell polyfunctional activation topology (PAT)- principal component analysis (PCA) plots. Each dot represents a single cell and are functionally clustered based on the cytokine secretion combination. The radius of each cluster is proportional to the secretion frequency of the corresponding group. The color of each cluster is weighted to the dominance of the T cells from a treatment group. The principal components are labeled according to their correlation with specific cytokines. Data shown from 4 independent experiments using 4 different PBMC and 4 allogeneic HUVEC donors.
