
Figure 2.
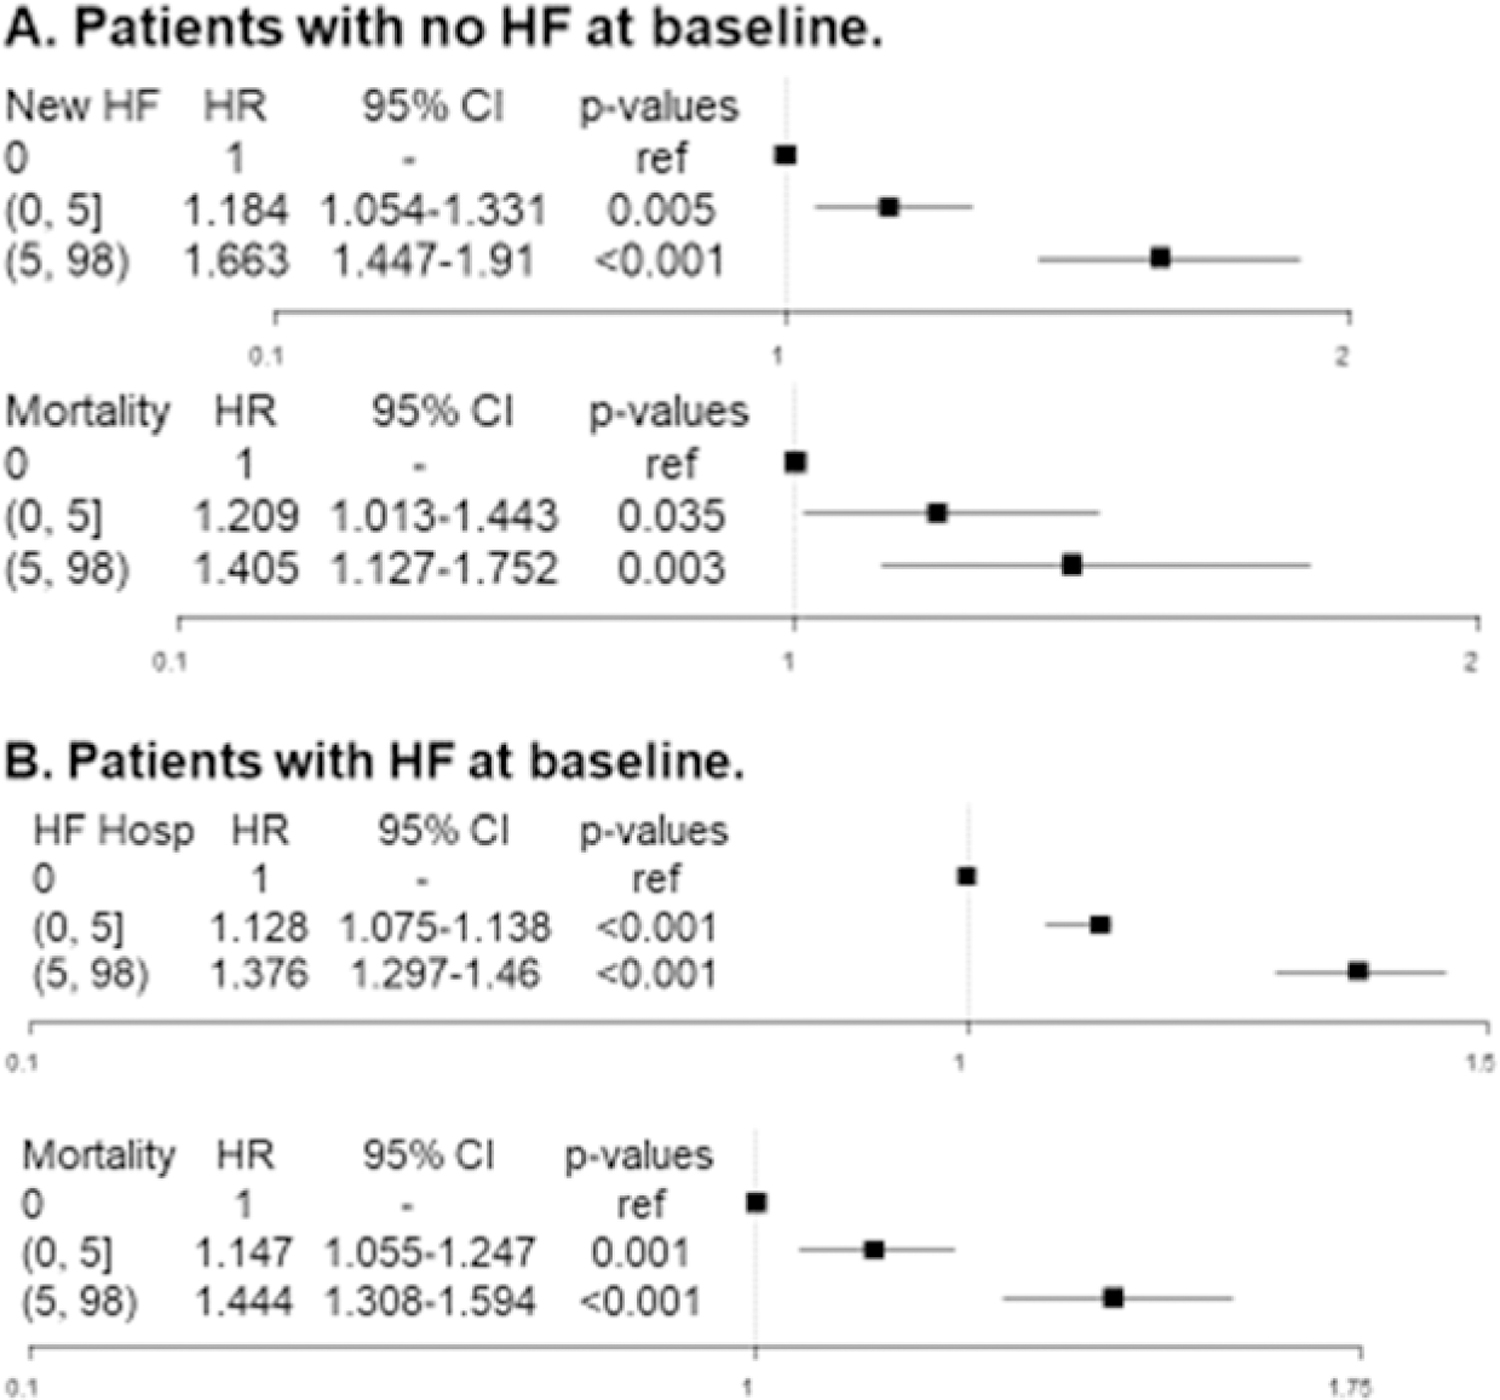
(Forest plots of new heart failure (HF) and all-cause mortality among patients with no HF at baseline (A) and HF hospitalization and mortality among Q7 patients with pre-existing HF (B) by percentage of atrial fibrillation burden. Parentheses indicate exclusive borders; brackets indicate inclusive borders. CI 5 confidence interval; HR 5 hazard ratio..