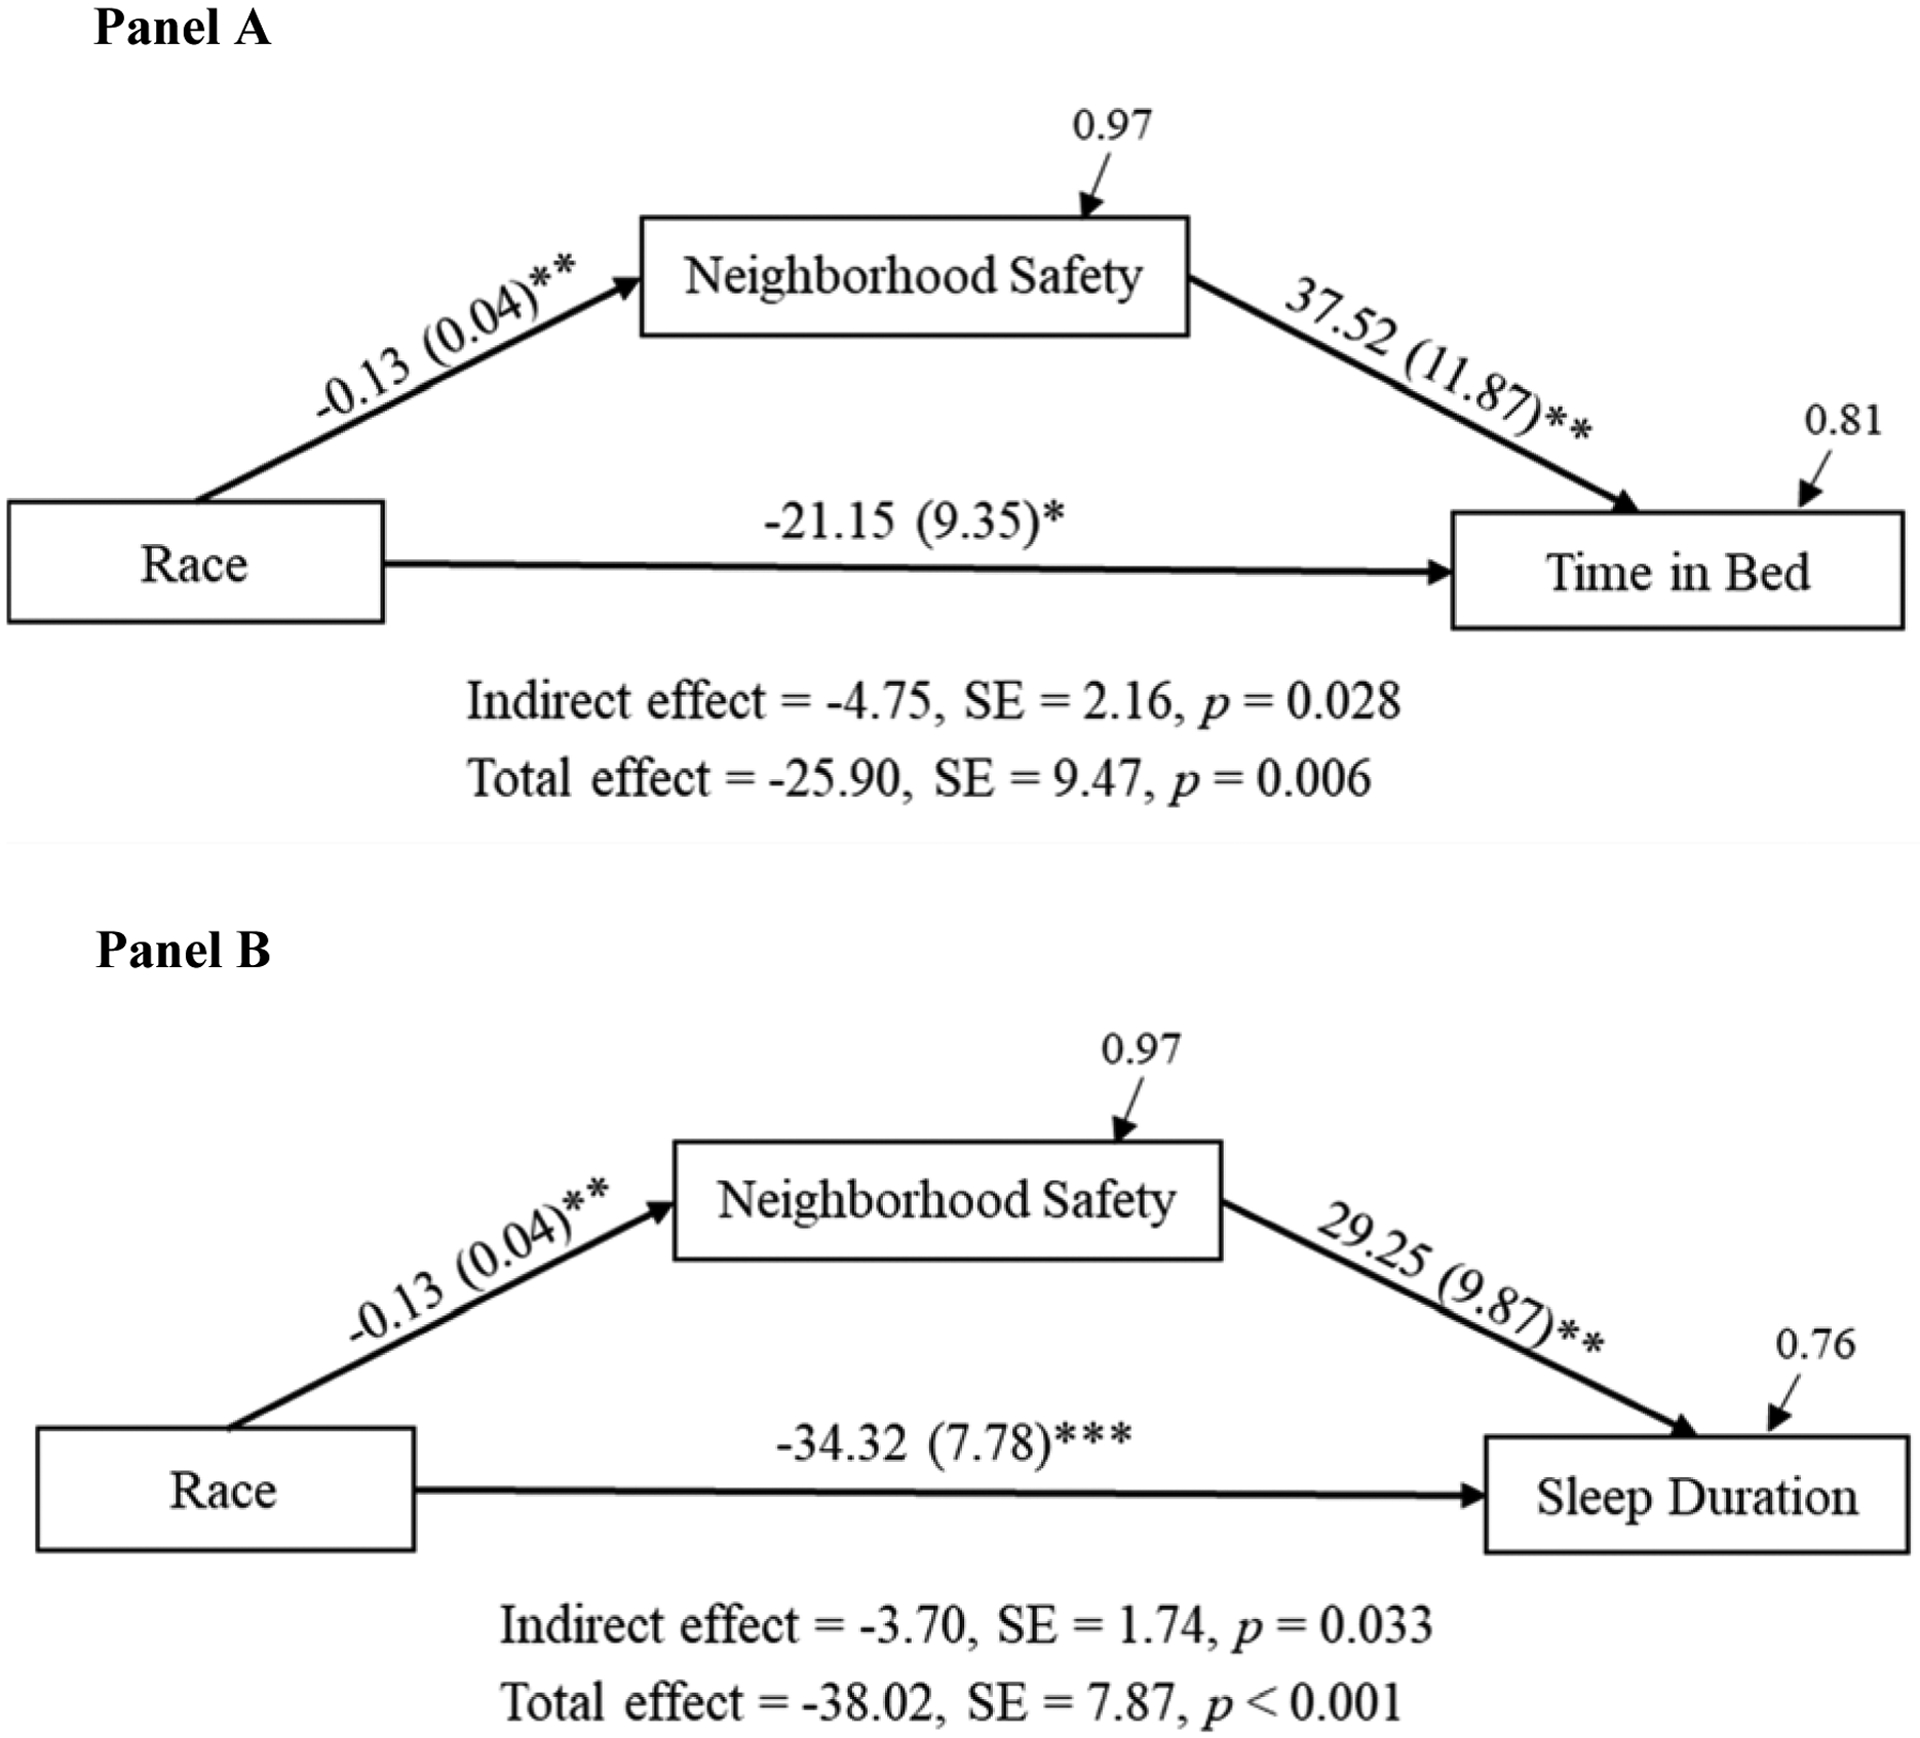
Figure 1.

Path model showing indirect effects of race on time in bed (Panel A) and sleep duration (Panel B) via neighborhood safety. Note. N = 263. Coefficients are from a fully adjusted model with Model 4 covariates. Path coefficients are unstandardized. Residual variances are standardized. Race is coded as White = 0, Black = 1. *p < 0.05. **p < 0.01. ***p < 0.001.
