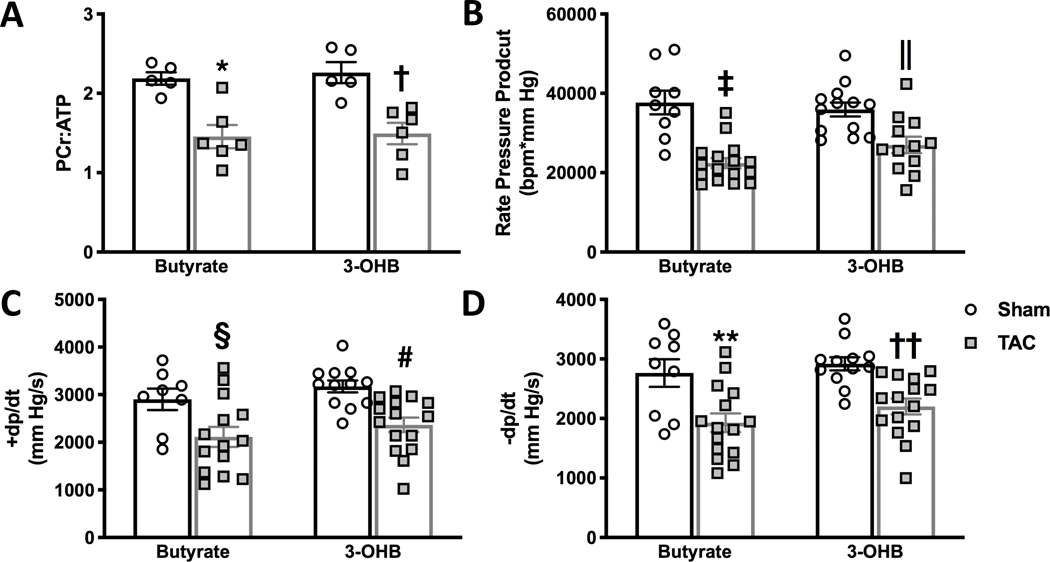
Figure 5 – Energetic and contractile status of hearts perfused with butyrate or 3-hydroxybutyrate (3-OHB).
A, phosphocreatine (PCr) to ATP ratio of hearts perfused with either butyrate or 3-OH 14 weeks after TAC or sham surgery, *p=0.0044 and †p=0.007 vs. sham group via 2-way ANOVA and Tukey’s post hoc test (n=5 for both sham groups, n=6 for both TAC groups). B, rate pressure product; C, maximum rate of pressure development (+dp/dt); and D, maximum rate of relaxation (-dp/dt) measured in left ventricle of isolated perfused hearts. ‡p<0.0001, §p=0.0089 vs. sham; ||p=0.0337, #p=0.0097 vs. sham; **p=0.0042, ††p=0.0083 vs. sham via 2-way ANOVA and Tukey’s post hoc test. For B, C, and D n=9 sham butyrate; n=13 sham 3-OHB; n=16 TAC butyrate; and n=12 TAC 3-OHB.

