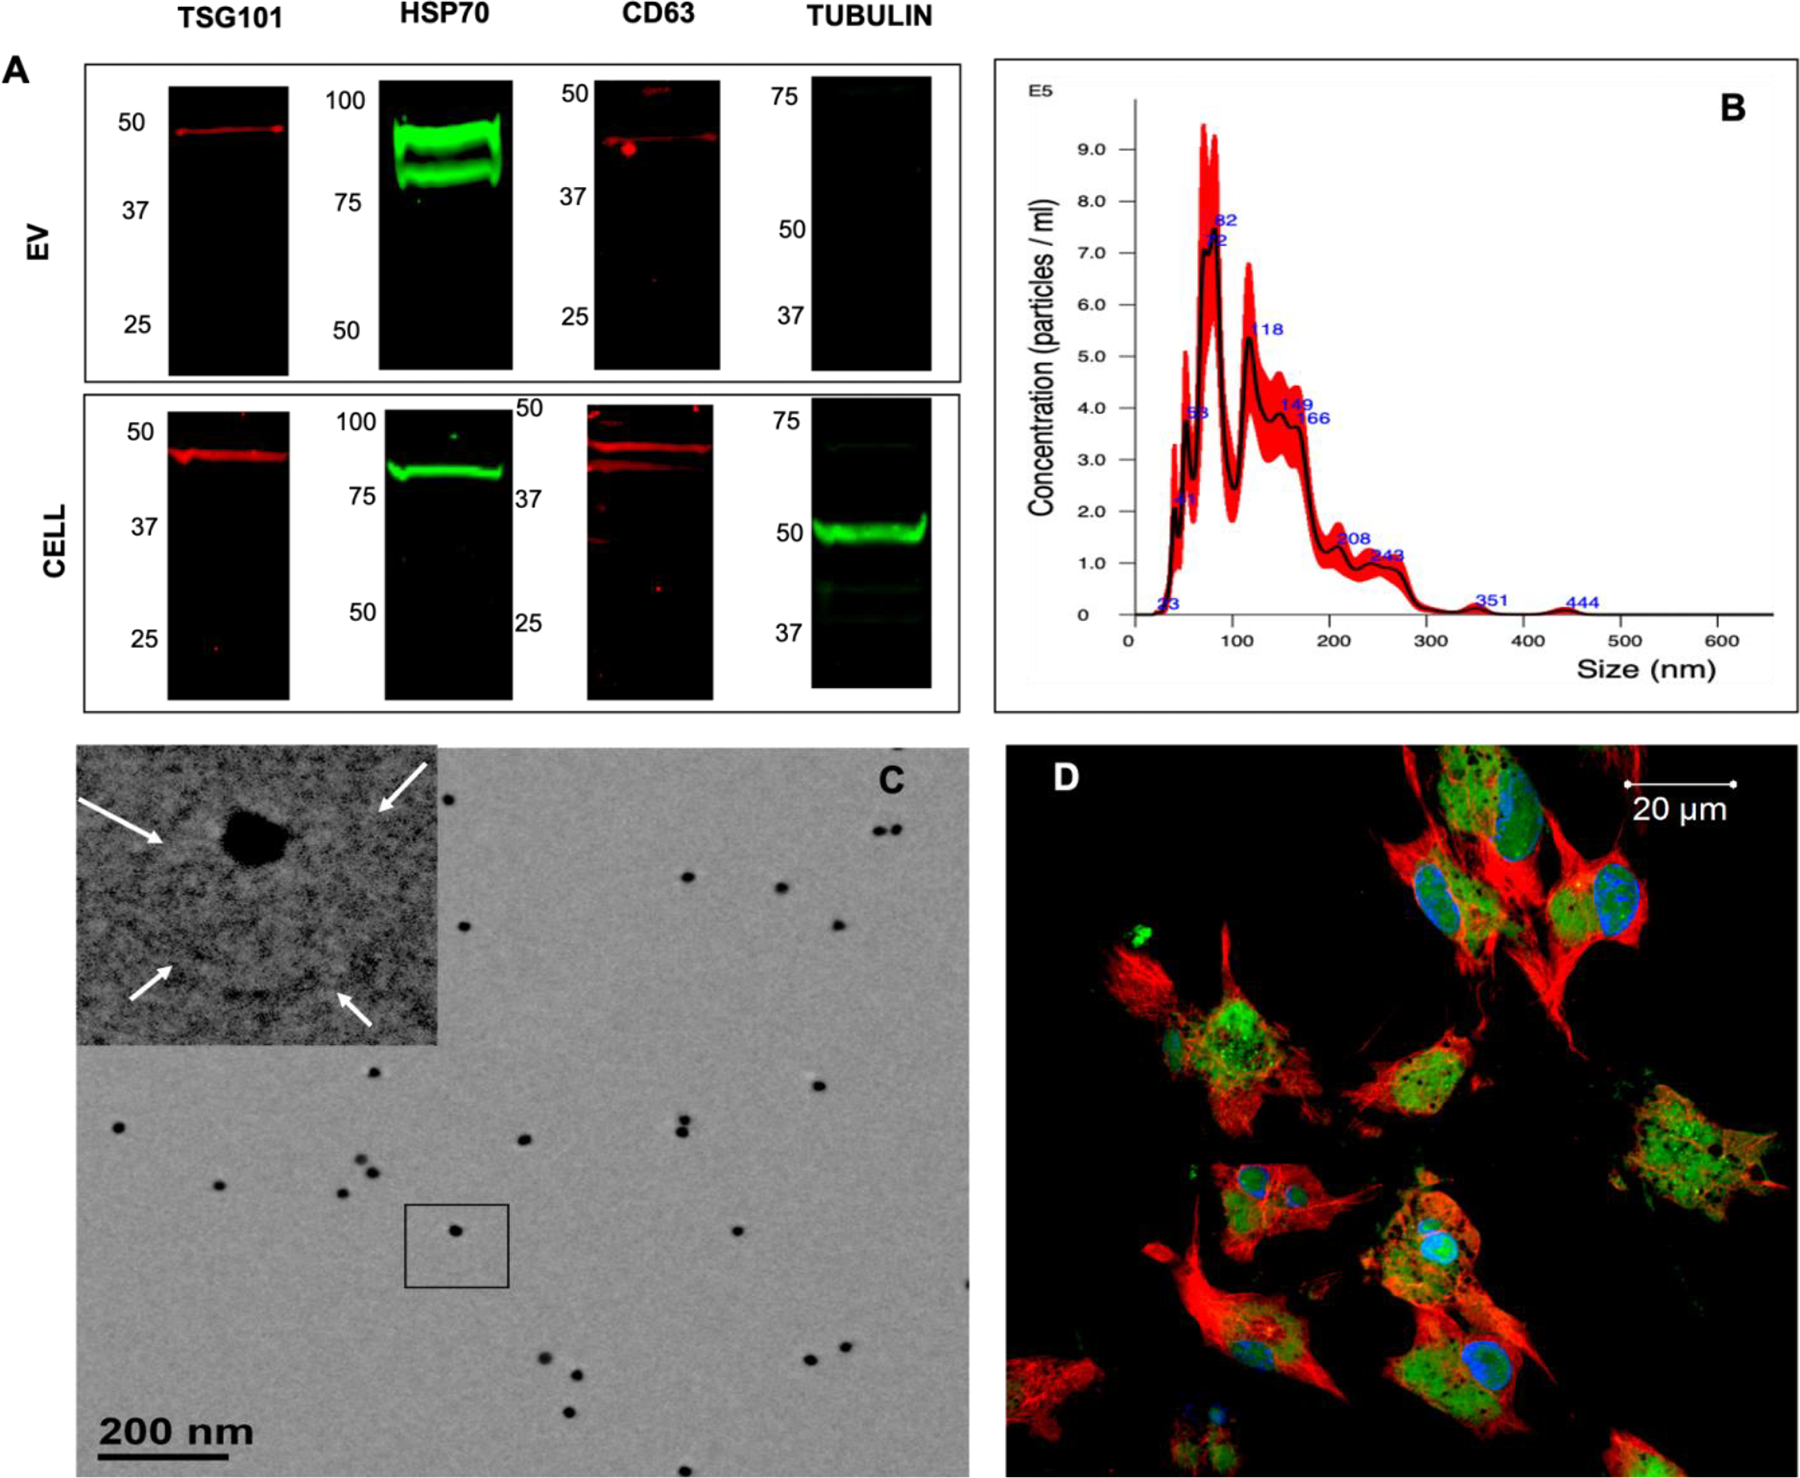
Figure 1. Characterization of EVs:

A) Immunoblots of FEE and cell lysates for the presence of TSG101, HSP70, CD63 exosomal marker proteins as well as for the intracellular protein control tubulin. Note the absence of tubulin in the EV lysates. B) Representative NTA plot of FEEs indicating the size distribution of the isolated EVs. C) Representative TEM image of FEEs immunolabeled for CD63 (20 nm gold dots). The insert represents the boxed area. The arrows in the insert point to the EV membrane. D) Confocal micrograph showing a representative image of the uptake of the fluorescently labeled FEEs (green) by HMSCs fluorescently stained with tubulin antibody (red) and DAPI nuclear stain (blue).
