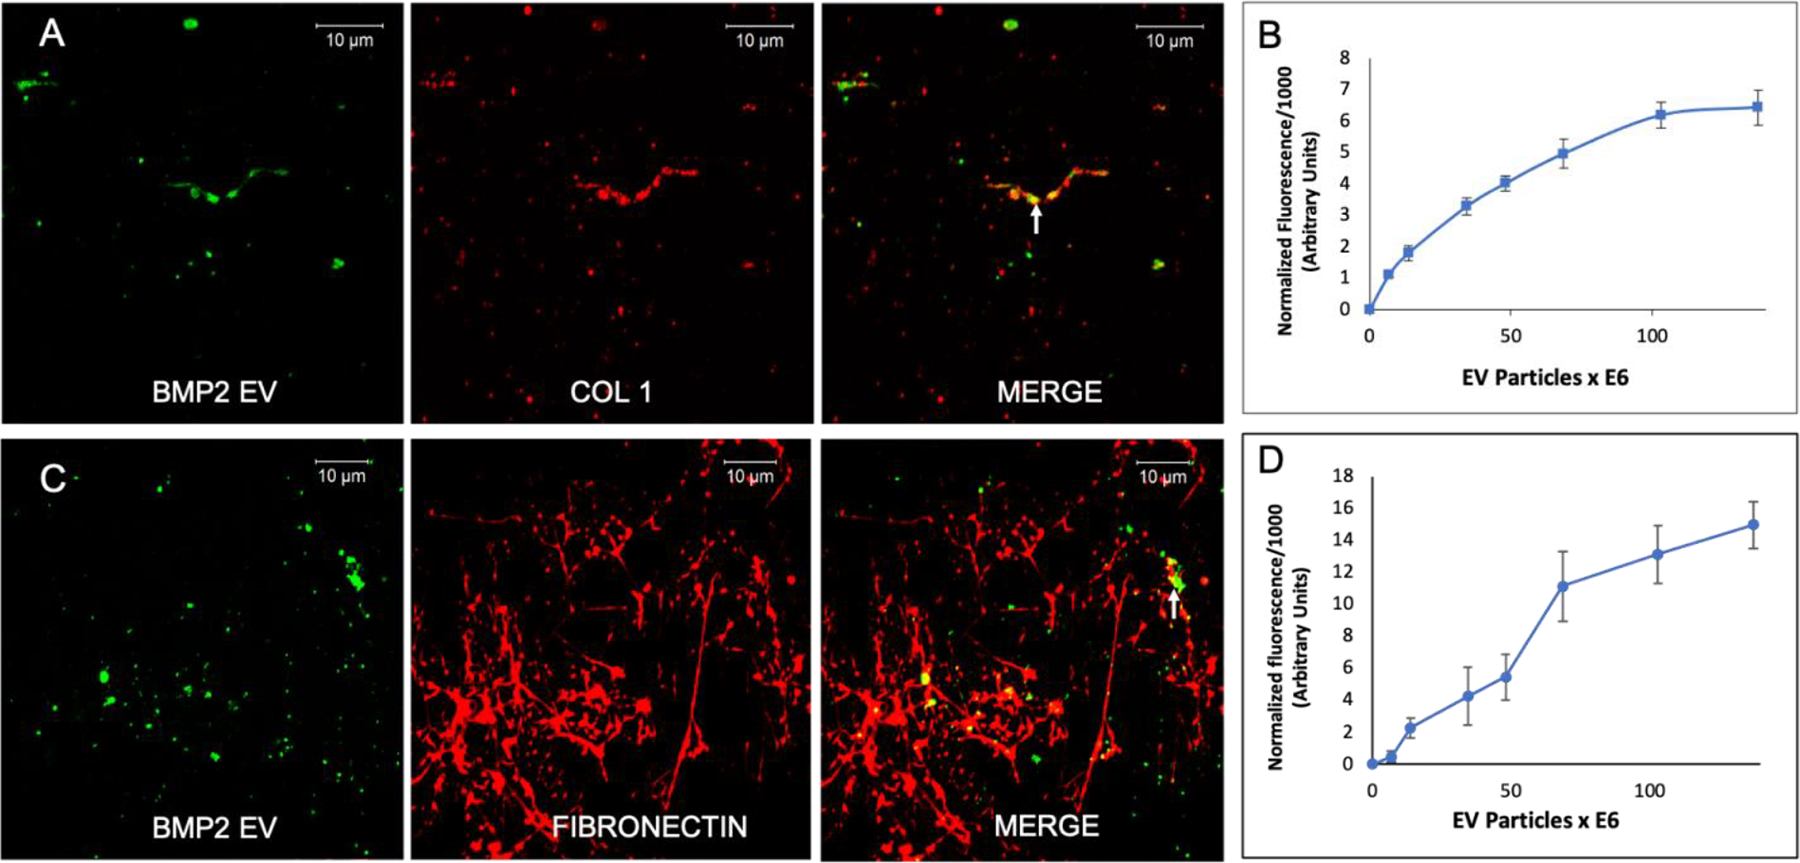
Figure 2. Binding of FEEs to ECM proteins:

A) Confocal micrograph showing a representative image of the binding of fluorescently labeled FEEs (green) to the decellularized ECM of HMSCs immunostained for type I collagen (red). Arrow in merged image points to a representative area of colocalization. Scale bar represents 10μm. B) Graphical representation of dose-dependent and saturable binding of fluorescently labeled FEEs to type I collagen coated assay plates (data points represent mean +/− SD, n=6). C) Confocal micrograph showing a representative image of the binding of fluorescently labeled FEEs (green) to the decellularized ECM of HMSCs immunostained for fibronectin (red). Arrow in merged image points to a representative area of colocalization. Scale bar represents 10μm. D) Graphical representation of dose-dependent and saturable binding of fluorescently labeled FEEs to fibronectin coated assay plates (data points represent mean +/− SD, n=6).
