
Figure 4. Release and integrity of alginate hydrogel encapsulated FEEs in a 3D system using RGD as a tether:
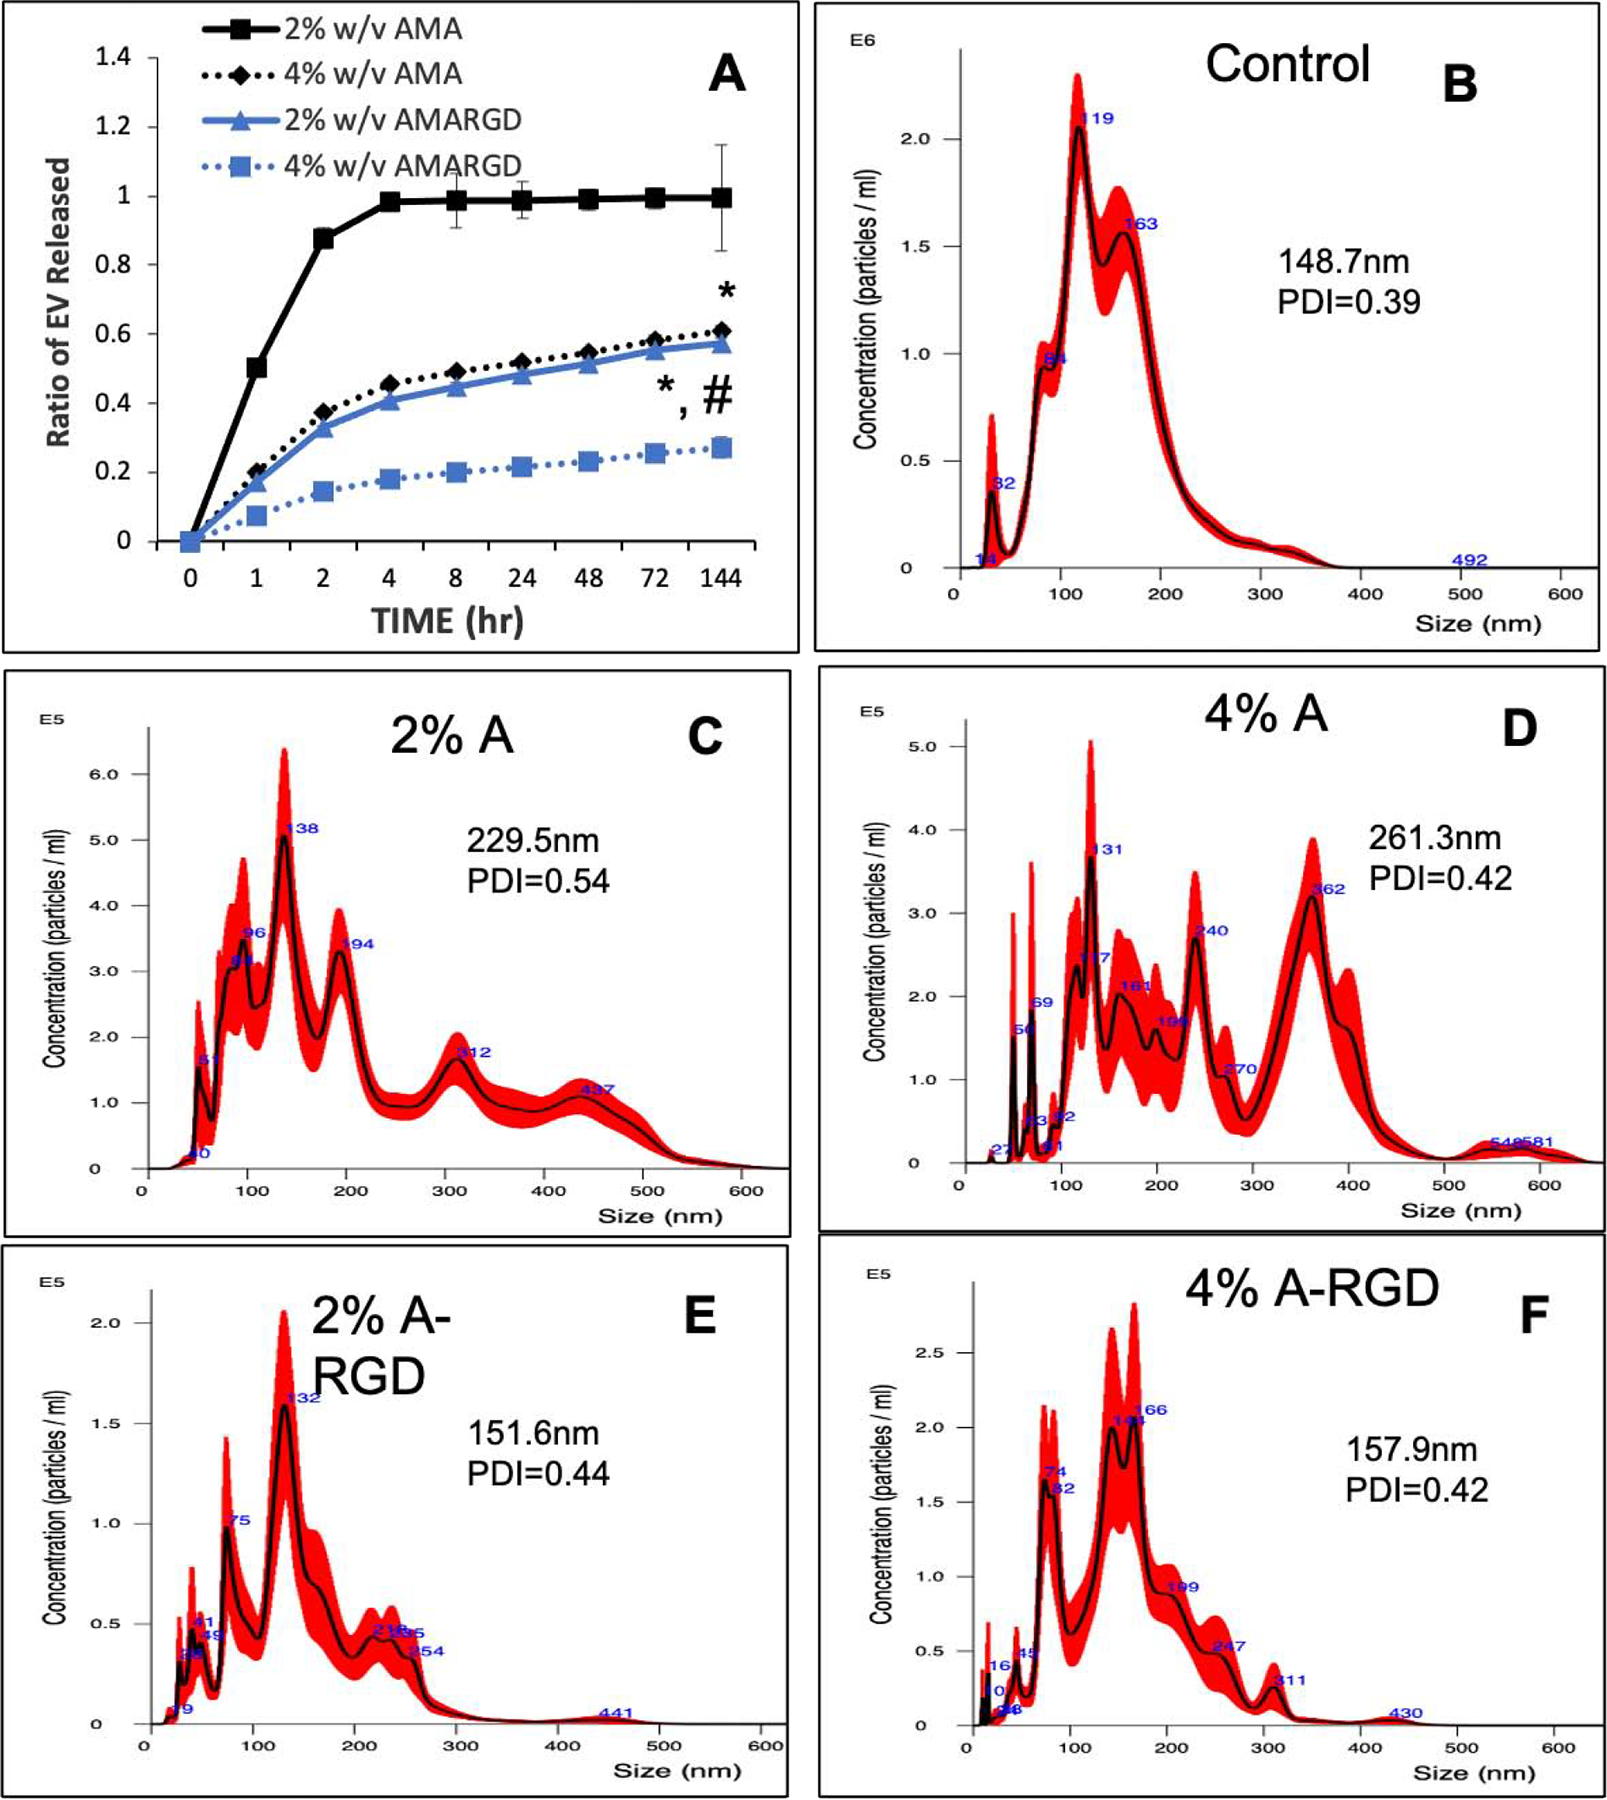
A) Graphical representation of 3D encapsulated fluorescently labeled FEE release from 2% (blue lines) and 4% (black lines) alginate hydrogels +/− RGD peptide over time. Data points represent mean +/− SD, n=6. * represents statistical significance with respect to RGD vs no RGD containing hydrogel pairs and # represents statistical significance of the 4% A-RGD group compared to the 2% A-RGD group calculated using Tukey’s ad hoc test post ANOVA. B, C, D, E and F) Representative NTA plots of FEEs released from each of the hydrogel groups indicating EV size distribution before (control (B)) and after release from the 2% (C) and 4% (D) alginate hydrogels as well as the 2% and 4% alginate hydrogels containing the RGD peptide (E and F respectively). The inserts in the figure show average particle size and the poly dispersity index (PDI).