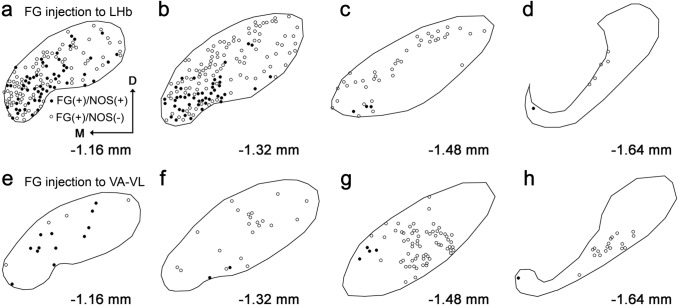
Fig. 10.
Distribution of EPN neurons labeled by FG injection into the LHb (a–d) and VA-VL (e–h). Each solid and open circle represents the position of NOS( +)/FG( +) and NOS(-)/FG( +) neuron, respectively. The position along the rostrocaudal axis is shown as the distance from bregma. Note that the number of labeled cells cannot be compared directly between the two experiments because of the difference in relative spread of FG in the injection site

