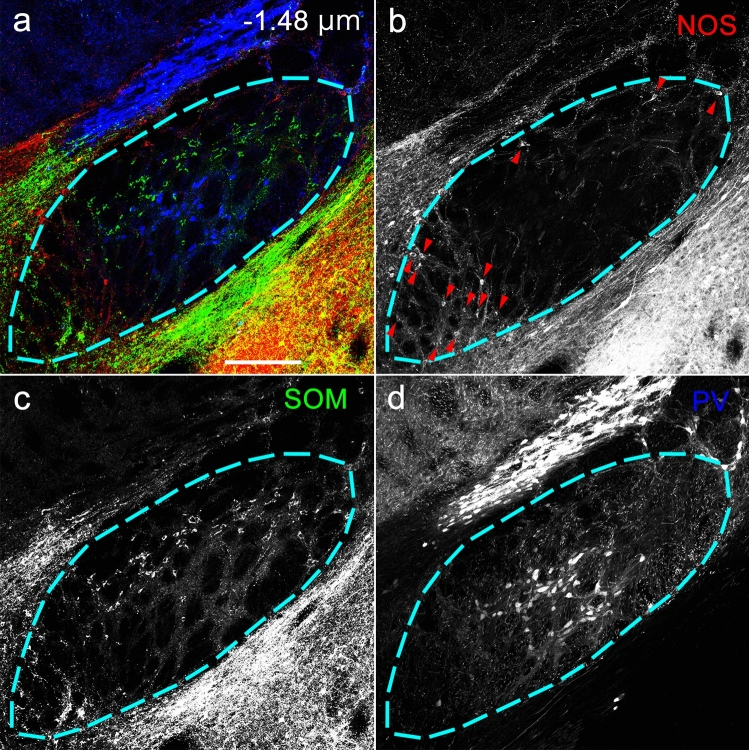
Fig. 2.
Triple-labeled immunohistochemistry for NOS, SOM, and PV in the caudal EPN. The pseudocolor image in (a) consists of NOS (red), SOM (green), and PV (blue) immunoreactivities, which are presented separately in (b–d). The area surrounded by the dashed line indicates the range of EPN determined by the SP immunoreactivity in the neighboring section. Arrowheads in (b) indicate NOS-positive neurons. The number in (a) represents the distance from bregma. Scale bar = 200 µm

