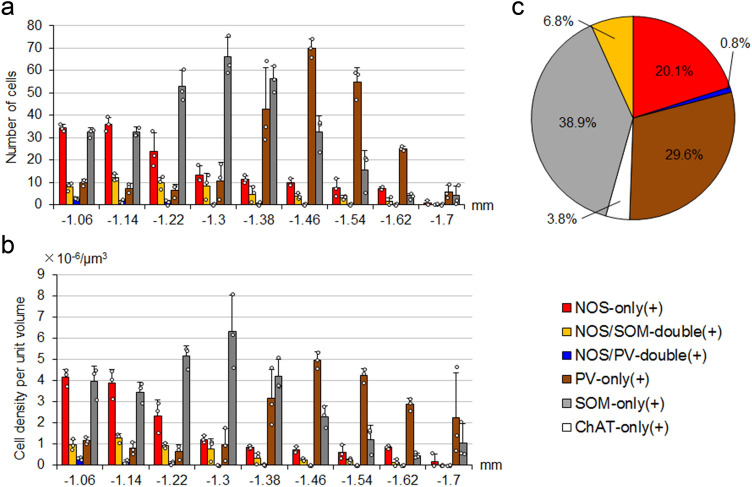
Fig. 6.
Quantitative analysis of EPN neurons. a, b The distributions of five types of neurons along the rostrocaudal axis in the EPN. The abscissa shows the relative position to bregma (mm). The ordinates in (a, b) show the number of cells in each section and the cell density per unit volume (mean ± standard deviation, n = 3 animals), respectively. Each dot represents a measured value obtained from a single section in each mouse. c Estimation of the proportion of the number of each type to all neuron number in the EPN

