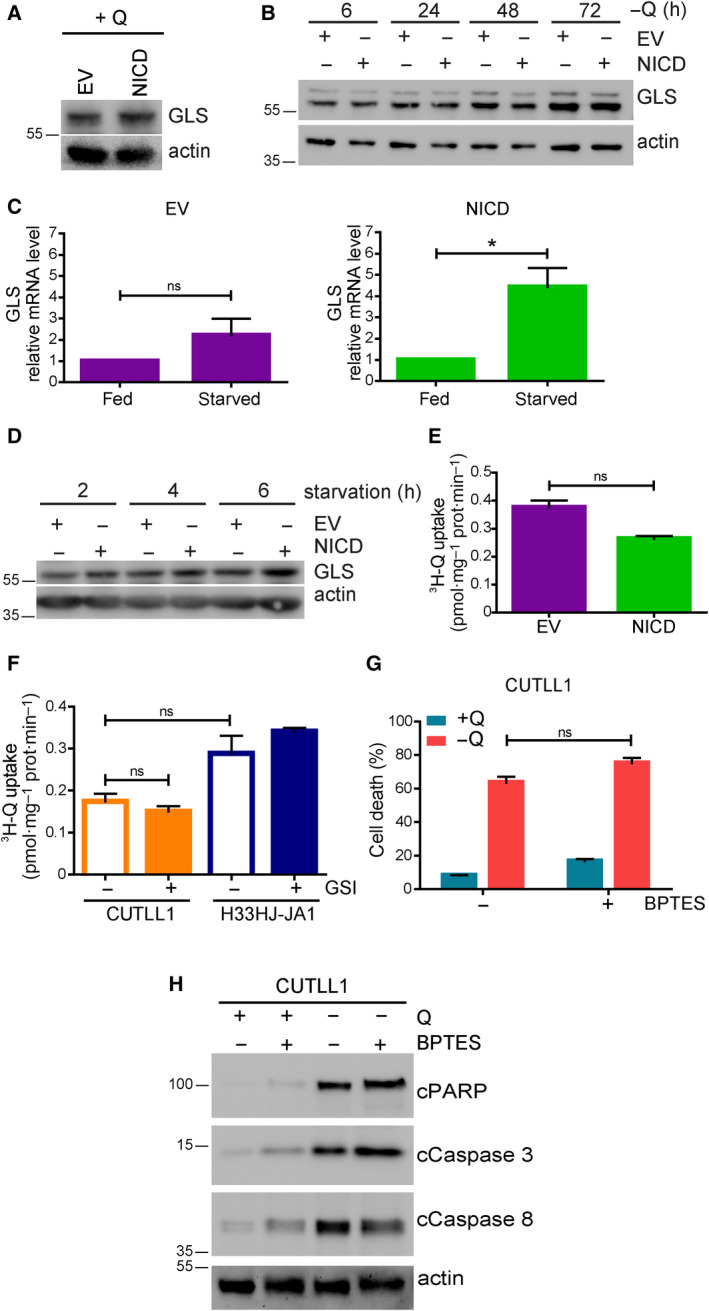
Fig. 5.

Notch1 modulated glutamine metabolizing enzymes in T‐ALL cells. (A) EV and NICD cells were incubated in a complete medium for 24 h. Cell extracts were collected and levels of GLS and actin were estimated by western blot. (B) EV and NICD cells were incubated in the absence of glutamine (−Q) for the indicated time. GLS and actin levels were determined by western blot analysis. (C) EV and NICD cells were incubated either in a complete medium (fed) or in a medium without amino acids (starved) during 72 h as indicated. Then, RNA content of these cells was extracted and GLS mRNA level was estimated by quantitative PCR. (D) EV and NICD cells were incubated in a medium without amino acids for the indicated time. Cell extracts were collected and levels of GLS and actin were estimated by western blot. (E) EV and NICD cells were incubated in the absence of glutamine and then incubated with radiolabeled 3H‐glutamine during 15 min. Cell content was extracted, and radiolabeled glutamine uptake was measured using a scintillation counter. (F) Glutamine‐starved CUTLL1 and H33HJ‐JA1 cells were incubated either in the presence or absence of GSI (DAPT 10 µm) for 72 h. Then, glutamine incorporation was determined as in E. (G‐H) CUTLL1 cells were incubated either in the presence or absence of glutamine (Q) and BPTES (30 µm) during 72 h as indicated. Cell death was estimated using a trypan blue assay (G), while cell extracts were collected and levels of cleaved PARP, cleaved caspase 3, cleaved caspase 8, and actin were estimated by western blot (H). Graphs show mean values ± SEM (n ≥ 3, *P < 0.05). Two‐way ANOVA followed by Bonferroni’s comparison as a post hoc test was used to evaluate the statistical difference between more than two groups. t‐Test analysis was used to evaluate the statistical difference between two groups.
