Fig. 7.

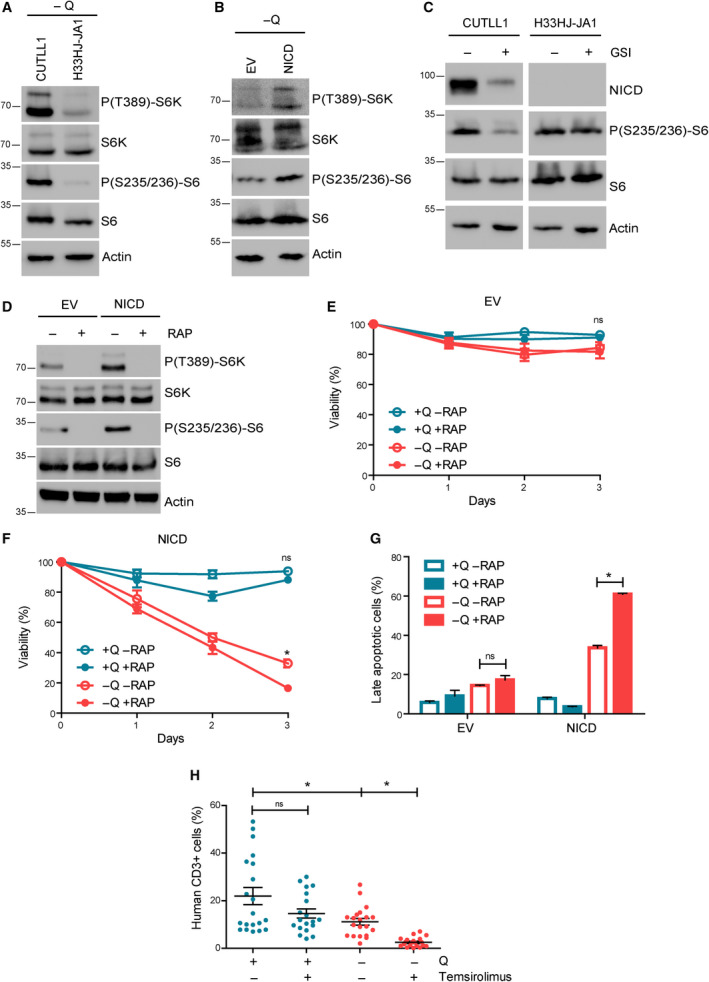
mTORC1 inhibition synergizes with glutamine starvation to induce cell death and to prevent leukemia progression in Notch1‐positive T‐ALL. (A) Western blot analysis of phospho‐S6K, total S6K, phospho‐S6, total S6, and actin of CUTLL1 and H33HJ‐JA1 cells incubated in the absence of glutamine during 72 h as indicated. (B) Western blot analysis of phospho‐S6K, total S6K, phospho‐S6, total S6, and actin of EV and NICD cells incubated in the absence of glutamine during 72 h as indicated. (C) Western blot analysis of NICD, phospho‐S6, total S6, and actin of CUTLL1 and H33HJ‐JA1 cells incubated either in the presence or the absence of GSI (DAPT 10 µm) for 72 h as indicated. (D) Western blot analysis of phospho‐S6K, total S6K, phospho‐S6, total S6, and actin of glutamine‐starved EV and NICD cells incubated in the presence or the absence of RAP (100 nm) for 72 h as indicated. (E‐F) Cell viability, as estimated by trypan blue assay, of EV (E) and NICD (F) cells incubated either in the presence or the absence of glutamine (Q) and RAP (100 nm) for the indicated time. (G) Late apoptotic cell percentage of EV and NICD cells incubated either in the presence or in the absence of glutamine (Q) and RAP (100 nm) for 72 h. Late apoptotic cell percentage was quantified using flow cytometry analysis of 7‐AAD and annexin V content. (H) Infiltration of leukemic human (CD3 positive) cells in the bone marrow of mice implanted with NICD H33HJ‐JA1 cells, fed either in the presence or in the absence of glutamine (Q), and treated with temsirolimus (4 mg·kg−1, twice a week), a derivative of RAP (20 mice/group). Graphs show mean values ± SEM (n ≥ 3, *P < 0.05). Two‐way ANOVA followed by Bonferroni's comparison as a post hoc test was used to evaluate the statistical difference between more than two groups.
