Fig. 3.

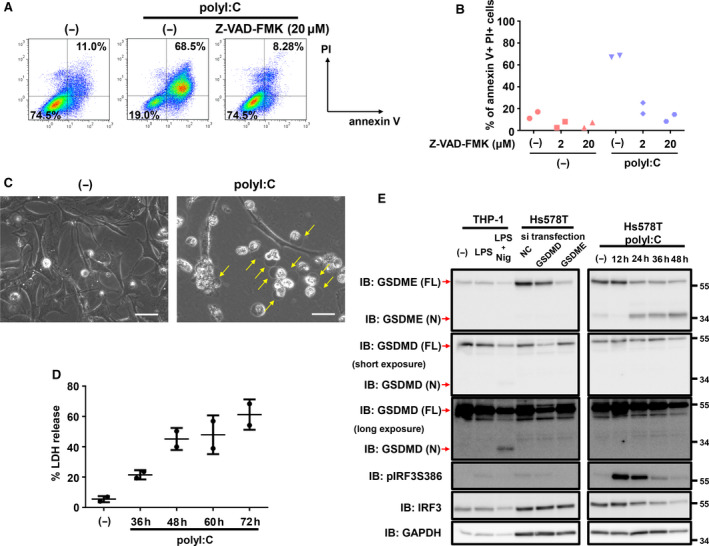
Characteristics of polyI:C‐induced cell death. (A, B) Flow cytometric analysis of polyI:C‐transfected cells with or without Z‐VAD‐FMK treatment. Prior to polyI:C transfection, Hs578T‐HA cells were treated with Z‐VAD‐FMK. Twelve hours after transfection, culture media were changed to serum‐free media with or without Z‐VAD‐FMK. Cells were collected after 36 h of serum starvation and stained with annexin V‐APC and PI. The percentage of annexin V‐positive and PI‐positive populations in the FSC‐gated and SSC‐gated cells are shown. Data were obtained from two biological replicate samples in panel (B). (C) Phase‐contrast micrographic imaging of polyI:C‐transfected Hs578T‐HA cells. Arrows indicate swelling cells. Twelve hours after transfection, culture media were changed to serum‐free media. Cells were analyzed after 36 h of serum starvation. Scale bars, 50 μm. (D) Percentage of LDH released from Hs578T cells transfected with polyI:C (1 μg·mL−1) at the indicated time points post‐transfection. Data are shown as the mean of two biological replicate samples. Error bars indicate the SD. (E) Immunoblotting for GSDME and GSDMD after transfection of polyI:C (1 μg·mL−1) in Hs578T cells for the indicated time. Twelve hours after transfection, culture media were changed to serum‐free media. Identities of the GSDMD and GSDME bands were confirmed using GSDMD‐knocked down and GSDME‐knocked down Hs578T cells and THP1 cells primed by LPS (10 μg·mL−1, 48 h) and treated with nigericin (20 μm, 2 h). Representative data from two independent experiments are shown.
