Fig. 4.

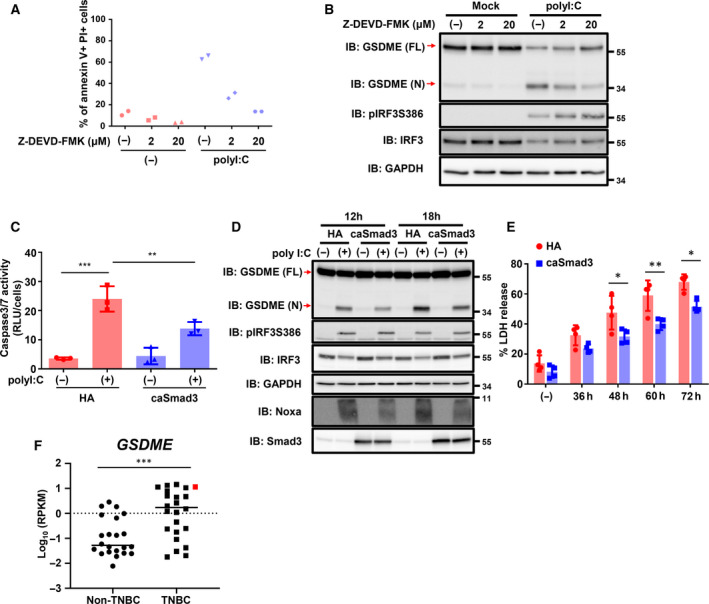
Caspase 3‐dependent pyroptosis induced by polyI:C transfection and the involvement of TGF‐β signaling. (A, B) Prior to transfection of polyI:C (1 μg·mL−1) in Hs578T‐HA cells, Z‐DEVD‐FMK was added to the cells. Twelve hours after transfection, culture media were changed to serum‐free media with or without Z‐DEVD‐FMK. (A) Flow cytometry analysis with annexin V‐APC and PI staining was performed 36 h after serum starvation. (B) Cells were lysed and analyzed by immunoblotting for GSDME 12 h postserum starvation. Data were obtained from two biological replicate samples and representative data are shown. (C) Caspase 3/7 activity in Hs578T‐HA or Hs578T‐caSmad3 cells after transfection with polyI:C was assessed using a Caspase‐Glo 3/7 Assay System. Twelve hours after transfection, culture media were changed to serum‐free media. The assay was performed 12 h postserum starvation. Caspase 3/7 activity was normalized to the number of cells that survived. Data are shown as the mean of three biological replicate samples, and the error bars indicate the SD. **P < 0.01, ***P < 0.001 by the Tukey–Kramer test. (D) Immunoblotting of Hs578T‐HA or Hs578T‐caSmad3 cells for GSDME after transfection with polyI:C (1 μg·mL−1) at the indicated time points. Representative data from three independent experiments are shown. (E) Percentage of LDH released from Hs578T‐HA or Hs578T‐caSmad3 cells after transfection with polyI:C (1 μg·mL−1) at the indicated time points. Data are shown as the mean of four biological replicate samples. Error bars, SD. *P < 0.05, **P < 0.01 by the Tukey–Kramer test. (F) GSDME expression (non‐TNBC cell lines, n = 22; vs TNBC cell lines, n = 24) deposited in the CCLE database. The red square corresponds to the Hs578T cells. ***P < 0.001 by Student's t‐test.
