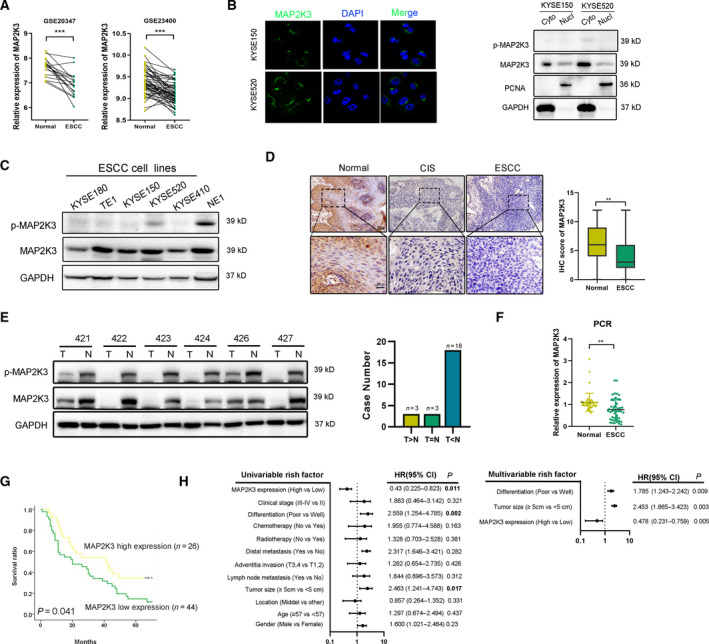
Fig. 2.

Expression of MAP2K3 in ESCC tissues and its clinical parameters. (A) Expression of MAP2K3 in ESCC and case‐matched normal epithelium was explored in the GSE database (GSE20347 n = 34 and GSE23400 n = 106). (B) MAP2K3 expression was detected in KYSE150 and KYSE520 by immunofluorescence and nucleus/cytoplasmic assay. (C) Western blot for p‐MAP2K3 and MAP2K3 in ESCC cell lines (KYSE180, TE1, KYSE150, KYSE520, and KYSE410) and an immortalized esophageal cell line (NE1). (D) Representative IHC detection of MAP2K3 in ESCC (n = 140), carcinoma in situ (CIS) (n = 12), and normal epithelial tissues (n = 140). Immunostaining of MAP2K3 in ESCC and normal groups was scored (scale bar: 100 µm, 20 µm, respectively). (E) Western blot for protein expression of MAP2K3 in ESCC (T) and case‐matched normal (N) tissues (n = 24). (F) MAP2K3 was detected in 34 pairs of ESCC and case‐matched normal esophageal epithelial tissues by qRT‐PCR. (G) Kaplan–Meier analysis showed that ESCC patients with high levels of MAP2K3 expression (n = 26) had longer survival times compared with low MAP2K3‐expressing patients (n = 44) (P = 0.041, log‐rank test). (H) Forest plot showing the association between MAP2K3 expression and ESCC survival using univariate and multivariate analyses (HR, hazard ratio; CI, confidence interval). Error bars represent the SD from at least three independent biological replicates. (*P < 0.05; **P < 0.01; ***P < 0.001 by Student’s t‐test).
