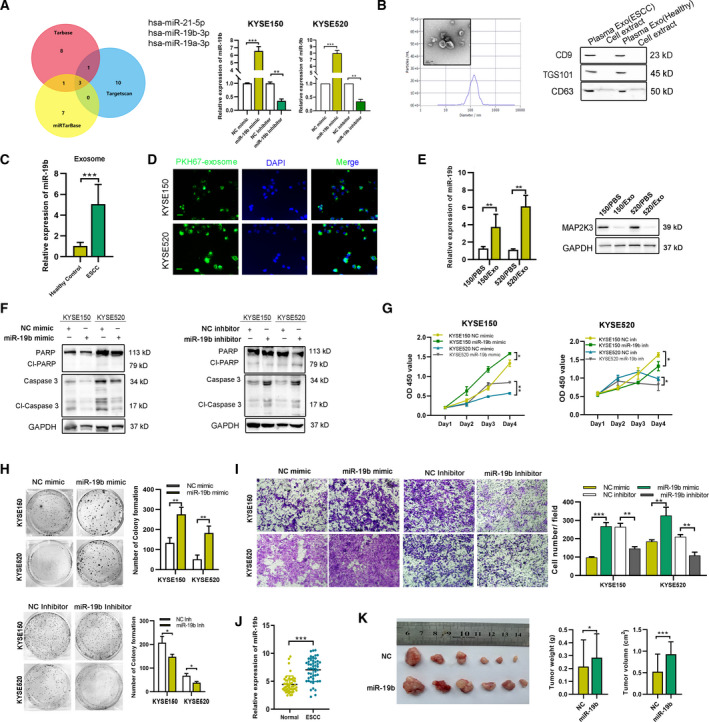
Fig. 6.

Exosomal miR‐19b‐3p‐mediated cell proliferation and invasion via suppressing MAP2K3. (A) Venn Diagram: Number of predicted miRNAs from TargetScan, DIANA‐TarBase, and miRTarBase is shown, identifying three miRNAs: miR‐21‐5p, miR‐19a‐3p, and miR‐19b‐3p. The transfection efficiency was detected after miR‐19b‐3p mimic or inhibitor transfection. (B) The exosomes were identified using transmission electron microscopy, nanoparticle tracking analysis (NTA), and western blot analysis (scale bar, 100 nm). (C) Exosomal miR‐19b‐3p expression in healthy (n = 7) and ESCC patient (n = 7) plasma detected by qRT‐PCR. (D) ESCC patient plasma‐derived exosome was dyed with PKH67 (green) and cocultured with ESCC cells for 12 h (scale bar, 100 nm). (E) The expression of miR‐19b‐3p and MAP2K3 in ESCC cells with indicated treatment was detected by qRT‐PCR and western blot. (F) Western blot for apoptosis biomarkers, PARP, and caspase 3 after miR‐19b‐3p mimic transfection. (G) CCK8 assay was performed to detect the cell proliferation in KYSE150 and KYSE520 cells transfected with miR‐19b‐3p mimic, inhibitor, or control vector. (H) Colony formation of KYSE150 and KYSE520 cells transfected with miR‐19b‐3p mimic, inhibitor, or control vector was detected. (I) Cell invasion ability was detected by Transwell assay in KYSE150 and KYSE520 cells transfected with miR‐19b‐3p mimic, inhibitor, or control vector. (J) The expression of miR‐19b‐3p was detected by IHC in ESCC tissues and case‐matched normal esophageal epithelial (n = 48). (K) The 5‐week‐old BALB/C nude mice (6 per group) were injected with stable miR‐19b‐3p expression or control cells, and then, the tumor volume and weight were measured after 4 weeks. Error bars represent the SD from at least three independent biological replicates. (*P < 0.05; **P < 0.01; ***P < 0.001 by Student’s t‐test).
