Fig. 7.

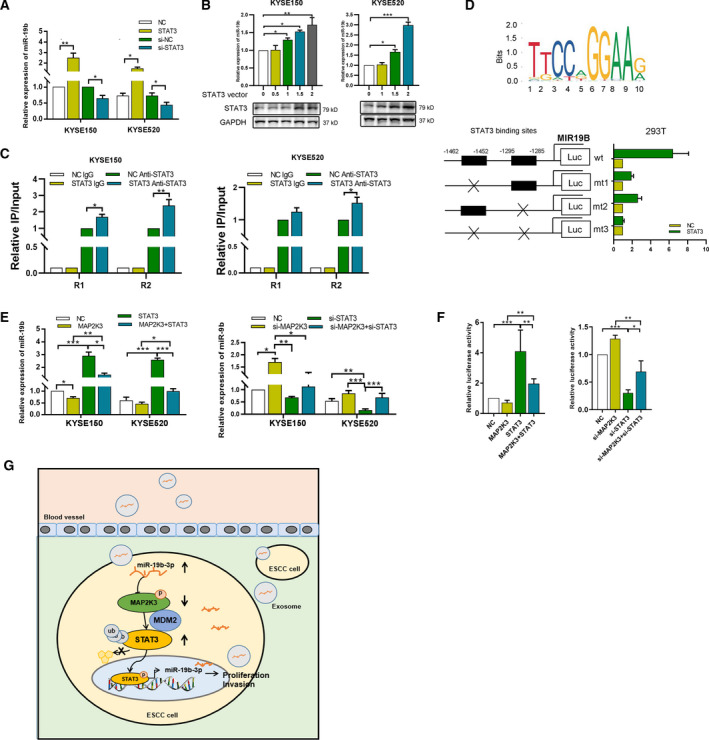
STAT3 binds with miR‐19‐3p promoter to increase miR‐19‐3p expression. (A) The expression of miR‐19b‐3p was detected in STAT3 overexpressed and knockdown KYSE150 and KYSE520 cells. (B) The expression of miR‐19b‐3p was detected in different doses of STAT3 plasmids transfected KYSE150 and KYSE520 cells. (C) ChIP assay was performed to detect the binding of STAT3 in the promoter of MIR19 after STAT3 transfection. (D) The binding motif of STAT3 (upper panel). The HEK‐293T cells were cotransfected STAT3 or control with different combinations of wild‐type (wt) and mutated reporter constructs (mt1, mt2, or mt3). The relative luciferase activity was measured (lower panel). (E) The expression of miR‐19b‐3p was detected in KYSE150 and KYSE520 cells with indicated transfection. (F) The relative luciferase activity of MIR19B was analyzed in the indicated transfected KYSE150 and KYSE520 cells. (G) Schematic model of the role of miR‐19b‐3p/MAP2K3/STAT3 feedback loop in regulating ESCC tumorigenesis. Error bars represent the SD from at least three independent biological replicates. (*P < 0.05; **P < 0.01; ***P < 0.001 by Student’s t‐test).
