
Fig. 1.
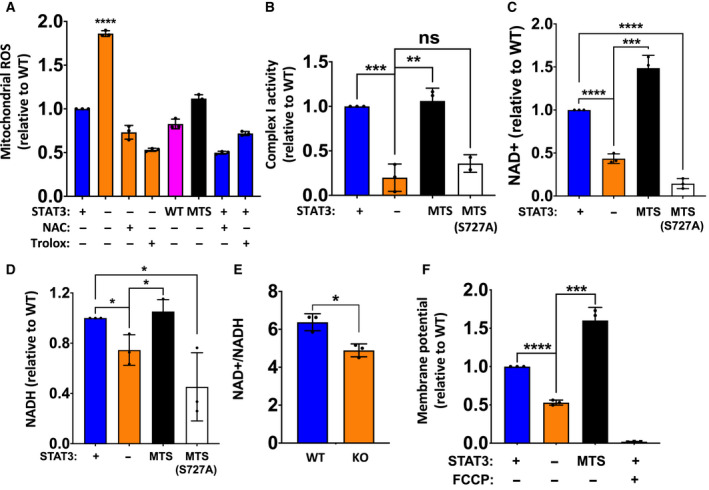
Mitochondrial STAT3 positively regulates complex I function and cellular NAD+ concentration. (A) Mitochondrial ROS measured for STAT3 WT, KO, KO + WT, and KO + MTS MDA‐MB‐231 cells. STAT3 WT and KO cells were treated with antioxidants (25 mm NAC or 250 μm Trolox) for 8 h where indicated before measurement. Only STAT3 KO was significantly different from others (P < 0.001, one‐way ANOVA). (B) Complex I activity for STAT3 WT, KO, KO + MTS (WT), and KO + MTS (S727A) cells. (C) NAD+ and (D) NADH levels in STAT3 WT, KO, KO + MTS (WT), and KO + MTS (S727A) cells. (E) NAD+/NADH ratio in MDA‐MB‐231 STAT3 WT and KO cells. (F) Mitochondrial membrane potential measured for STAT3 WT, KO, and KO + MTS cells using TMRE. Control cells were treated with 50 nm FCCP as indicated for 10 min before measurement. Student's t‐test: ****P < 0.0001, ***P < 0.001, **P < 0.01, *P < 0.05, ns = not significant, n = 3. Error bars represent ± SD.