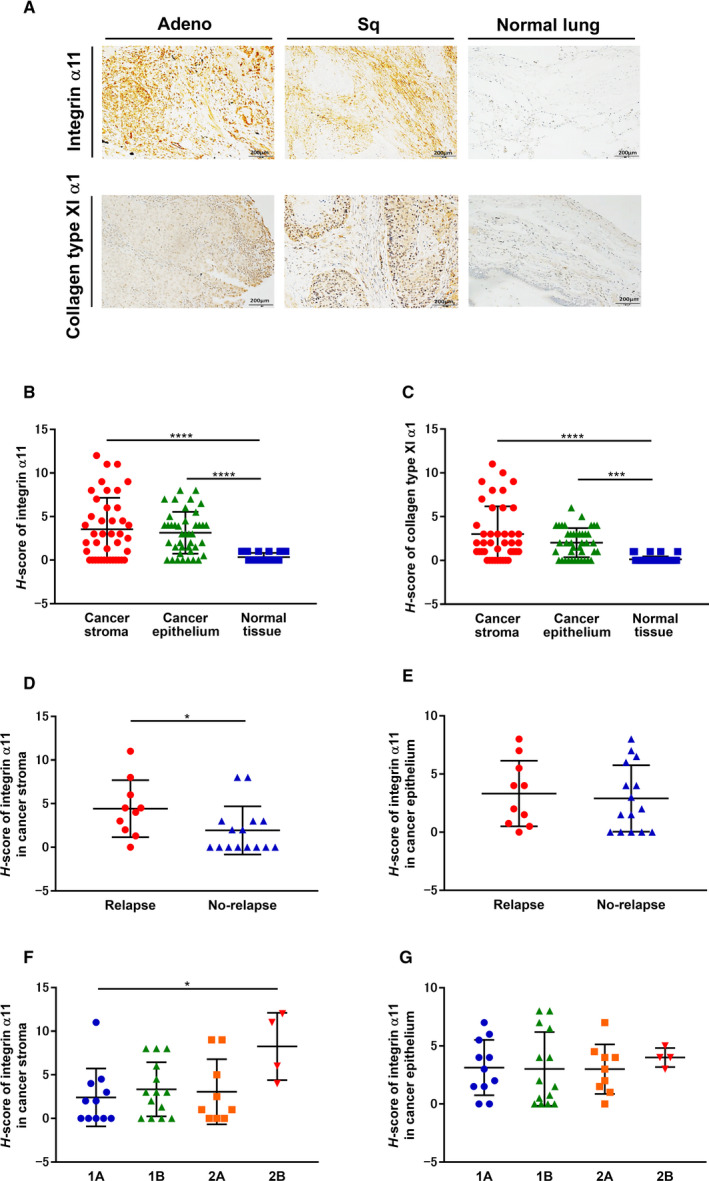
Fig. 2.

Immunohistochemical expression of ITGA11 and COL11A1 in cancer stroma (A) Immunohistochemical staining of human NSCLC tissues; representative sections of Adeno, Sq, and normal lung with ITGA11 and COL11A1 expressions are shown. Original magnification: 100×; Scale bars: 200 μm. (B) ITGA11 and (C) COL11A1 expression levels in each subject. (B, C; n = 41, one‐way ANOVA) Association between the recurrence and ITGA11 expression in (D) cancer stroma and (E) cancer epithelium. (D, E; n = 25, Mann–Whitney) Association between the pathological staging and ITGA11 expression in (F) cancer stroma and (G) cancer epithelium. (F, G; n = 38, one‐way ANOVA) Vertical axis: H‐score values (see Section 2.4). Each symbol represents one patient. The values represent the mean ± SD. *P < 0.05, ***P < 0.001, ****P < 0.0001. Adeno, Adenocarcinoma; Sq, squamous cell carcinoma.
