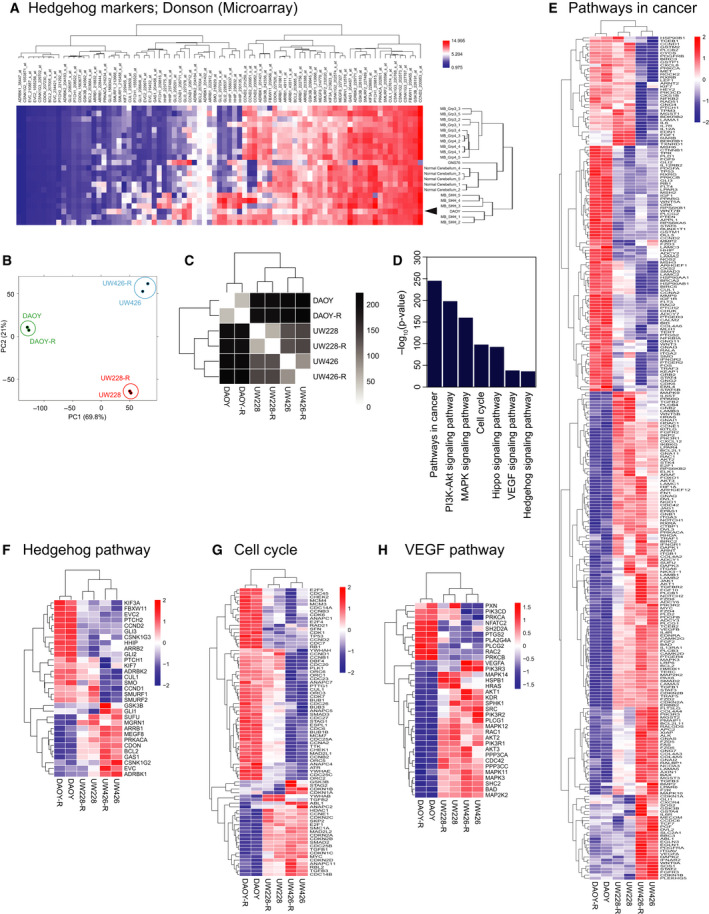
Fig. 2.

Gene expression profiling of human SHH‐MB cell lines demonstrates expression of hedgehog pathway markers. (A) Unsupervised hierarchical cluster analysis of gene expression involving hedgehog pathway in GSE86574. We isolated the expression profiles of normal cerebellum (n = 5), MB_SHH (n = 5), MB_Grp3 (n = 5), MB_Grp4 (n = 5), and two MB cell lines (DAOY and ONS76) from GSE86574, and performed hierarchical clustering assay. Expression values were Z‐score‐transformed. Red, high expression; blue, low expression. Arrowhead shows the position of DAOY clustered with MB_SHH patient samples. (B) Principal component analysis of gene expression landscape from LR/HR isogenic pairs of the three MB cell lines (DAOY/DAOY‐R, UW228/UW228‐R, and UW426/UW426‐R). (C) Hierarchical clustering analysis of gene expression landscape from DAOY/DAOY‐R, UW228/UW228‐R, and UW426/UW426‐R cells. (D) Enriched KEGG pathways on differentially expression genes (FDR adjusted P < 0.05) between LR/HR isogenic pairs of MB cell lines. The plot shows negative log 10‐transformed P‐values for the enriched pathways. (E‐H) Heatmap of DE genes in pathways in cancer (E), hedgehog signaling (F), cell cycle regulation (G), and VEGF signaling (H).
