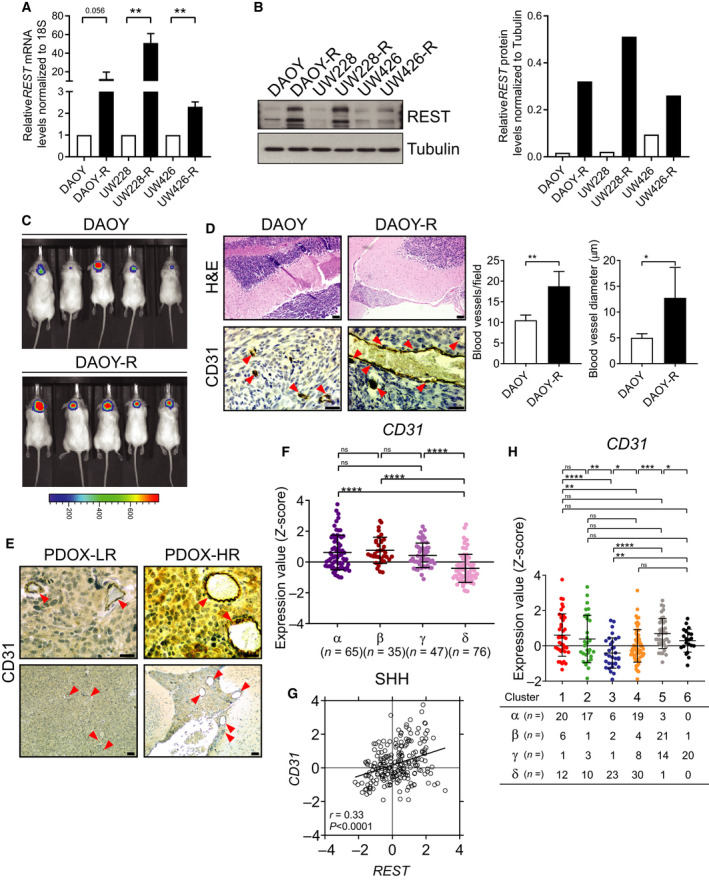
Fig. 3.

Human MBs with REST elevation have increased vasculature. (A, B) Relative REST mRNA and protein levels in DAOY/DAOY‐R, UW228/UW228‐R, and UW426/UW426‐R cells were measured by RT‐PCR and western blot analysis, respectively. Right panel in B shows quantification data. Tubulin served as a loading control. Data show individual variability and means ± SD. P‐values were obtained using Student's t‐test. *P < 0.05, **P < 0.01, ***P < 0.001, ****P < 0.0001. (C) Growth of DAOY‐ffluc and DAOY‐R‐ffluc cells implanted in the cerebella of immunodeficient mice (n = 5) was monitored by BLI. Color scale bar indicates luminescence intensity across the images. (D) Brain sections from the above mice were studied by H&E (top panel) to locate tumors, and IHC for CD31 (bottom panel) to identify tumor vasculature. Arrowheads show the blood vessels. Quantitation of blood vessels and average blood vessel diameter is shown in the right panel (n = 3; three fields/section). Scale bars: H&E = 20 μm; CD31 = 10 μm. (E) IHC for CD31 in tumor‐bearing brain sections of PDOX mice (n = 3., three fields/section) to demonstrate vasculature changes in tumors (left panels). Arrowheads show the blood vessels. Scale bars: top (40×) = 10 μm, bottom (10×) = 20 μm. (F) CD31 mRNA expression profile in four subtypes of SHH‐MB patient samples measured by microarray (α; n = 65, β; n = 35, γ; n = 47, δ; n = 76) from GSE85217 data set [4]. Each dot corresponds to one individual patient. Data show individual variability and means ± SD. P‐values were obtained using the unpaired t‐test with Welch's correction. ns, not significant. *P < 0.05, **P < 0.01, ***P < 0.001, ****P < 0.0001. (G) Scatter plot of correlation of REST mRNA expression and CD31 mRNA expression. Figure shows the plot across all 223 SHH‐MB patients (r = 0.33, P < 0.0001). (H) CD31 mRNA expression profile in SHH‐MB patient samples. Hierarchical clustering based on expression of neuronal differentiation markers divided the SHH‐MB patient samples into six distinct clusters (Cluster 1; n = 39, Cluster 2; n = 31, Cluster 3; n = 32, Cluster 4; n = 61, Cluster 5; n = 39, Cluster 6; n = 21) [10]. Each dot corresponds to an individual patient. Data show individual variability and means ± SD. ns, not significant. P‐values were obtained using the unpaired t‐test with Welch's correction. *P < 0.05, **P < 0.01, ***P < 0.001, ****P < 0.0001.
