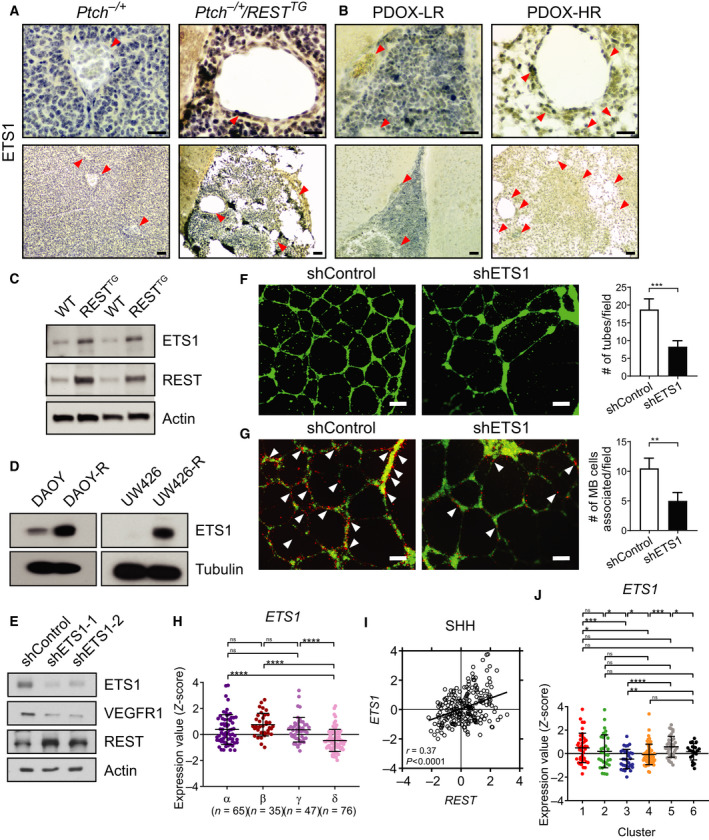
Fig. 6.

REST upregulates ETS1 expression. IHC was performed on cerebellar sections from (A) Ptch+/− and Ptch+/−/RESTTG transgenic mice (n = 3) and (B) PDOX (n = 3) to demonstrate ETS1 expression. Arrowheads show blood vessels. Scale bars: top (40×) = 10 μm, bottom (10×) = 20 μm. Western blot analysis to measure ETS1 and REST protein levels in (C) CGNPs from WT/RESTTG mice, (D) ETS1 levels in human DAOY/DAOY‐R and UW426/UW426‐R cells, and (E) ETS1, VEGFR1 and REST levels in shControl or shETS1‐1/shETS1‐2 expressing DAOY‐R cells. Tubulin and actin were used as loading controls. (F) In vitro tube formation assay to assess tube formation by HBMECs was done by culturing with conditioned medium from shControl or shETS1‐1 expressing DAOY‐R cells for 16 h in matrigel (left panels). Quantitation of tube formation is shown on the right. Three fields were counted per group. P‐values were obtained using Student's t‐test. ***P < 0.001, Scale bar; 100 μm. (G) In vitro tube formation assay to assess tube formation by HBMECs was done by coculturing HBMEC and shControl or shETS1‐1 expressing DAOY‐R cells for 16 h in matrigel (left panels). Quantitation of colocalization of DAOY‐R cells with HBMECs following ETS1 knockdown (using anti‐shETS1‐1—left panels) is shown on the right. P‐values were obtained using Student's t‐test. **P < 0.01. Scale bar; 100 μm. (H) Profile of ETS1 mRNA expression in microarray data of four subtypes of human SHH‐MB samples from GSE85217 data set [4]. Each dot represents a patient. Data show individual variability and means ± SD. P‐values were obtained using the unpaired t‐test with Welch's correction. ns, not significant. *P < 0.05, **P < 0.01, ***P < 0.001, ****P < 0.0001. (I) Scatter plot of correlation of REST mRNA expression and ETS1 mRNA expression. The figure shows the plot across all 223 SHH‐MB patients (r = 0.37, P < 0.0001). (J) ETS1 mRNA expression profile in SHH‐MB patient samples. Hierarchical clustering based on the expression of neuronal differentiation markers divided the SHH‐MB patient samples into six distinct clusters [10]. Each dot represents a patient. Data show individual variability and means ± SD. P‐values were obtained using the unpaired t‐test with Welch's correction. ns, not significant. *P < 0.05, **P < 0.01, ***P < 0.001, ****P < 0.0001.
