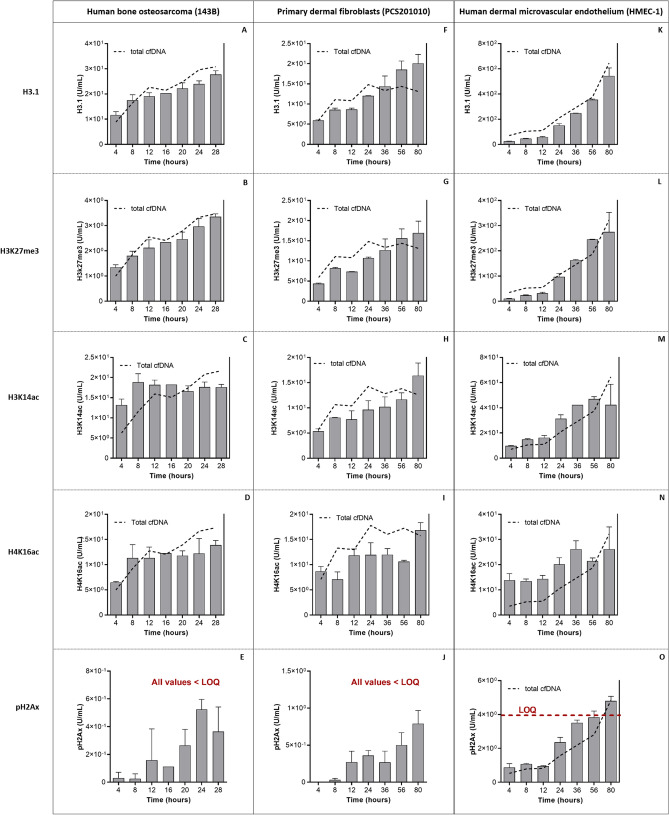
Figure 2.
Longitudinal measurements of nucleosomal H3.1 and histone PTMs in three cell lines. Using chemiluminescence based Nu.Q Immunoassays, total levels of H3.1, H3K27me3, H3K14ac, H4K16ac and pH2AX, respectively, were measured directly from 50 µL of cell culture supernatant collected at different time-points after increasing periods of incubation from (A-E) human bone osteosarcoma (143B) cells, (F-J) primary dermal fibroblasts (PCS201010), and (K–O) human dermal microvascular endothelial cells (HMEC-1). For all cell lines, each time-point bar represents the mean of measurements from two biological replicates (i.e., parallel characterization of two separate cell culture flasks), except for the 16 h time-point in 143B cells, for which data from one of the flasks was compromised due to experimental error and omitted. Error bars indicate standard deviation. As indicated in red text in Figs E, J and O, all measured pH2AX values were under the limit of quantification (LOQ) of the assay, except for the 80 h time-point in HMEC-1 cells. The dotted black lines overlayed on each graph illustrate the corresponding pattern of total cfDNA levels, as measured by a qPCR assay (data from Fig. 1G–I).

