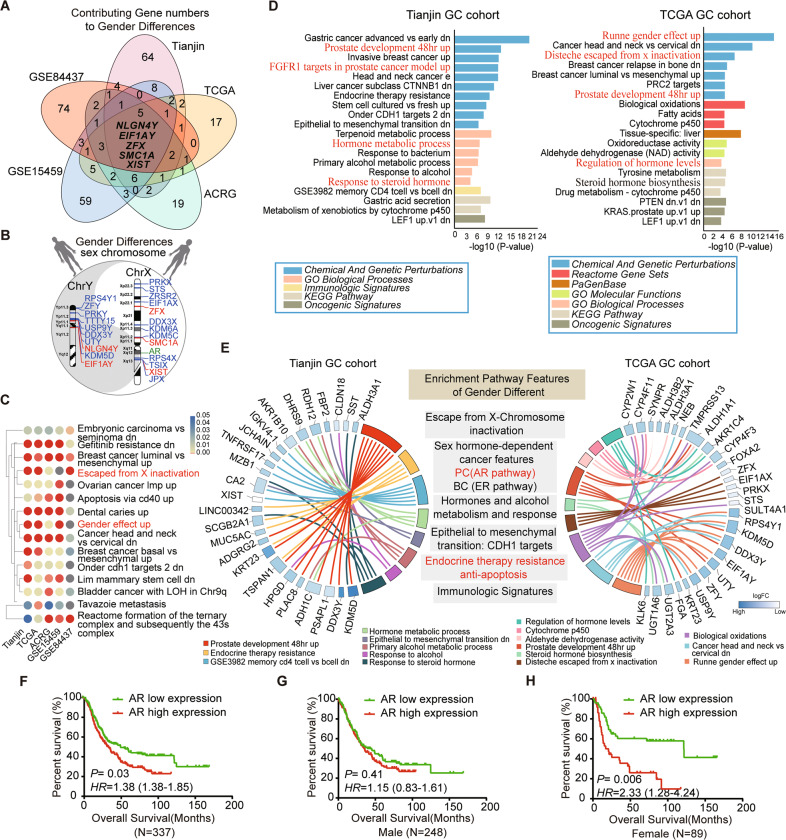
Fig. 1. Prediction of candidate factors to cause gender bias in GC.
A The Venn diagram was showing overlapping gene numbers of the top 100 high contribution value (attribution score) to gender difference identified from the five GC cohorts (Tianjin, TCGA, ACRG, GSE15459, and GSE84437) by using an algorithm of deep learning. The intersection of the Venn diagram shows the number and the name of overlapping genes among all five datasets. B The schematic diagram for overlapping gender bias-related gene locus in all five gene sets on sex chromosome X and Y by deep learning. Red represents the intersection of all five gene sets; blue represents the intersection of 4 or 3 GC gene sets; green represents the Androgen receptor (AR) on chromosome X. C The heatmap visualization of top 15 enriched terms across five gender- bias associated gene sets of GC using deep learning method. P < 0.05. Red terms represent candidate factors proposed to cause gender bias include X-chromosome abnormalities and sex hormones. D Bar plot ranking of the top 20 clusters by Metascape pathway enrichment analysis of differentially expressed genes between genders in Tianjin (left panel) and TCGA (right panel) datasets. Red terms highlight the X Chromosomal abnormalities, sex hormone, and hormone receptor-associated pathway and process. E Circos plot demonstrating the relationship between selected Metascape clusters and their genes in Tianjin (left) and TCGA (right) dataset. Genes are located on the left (Tianjin circos) or right (TCGA circos) side of the graph and indicated by their symbols. The logFC values of genes are exhibited by heatmap. Gene involvement in the Metascape clusters was determined by connecting lines. The representative pathways and biological process features, which were related to gender differences, are listed in gray background boxes in the middle panel. PC: prostate cancer, BC: breast cancer. F Kaplan–Meier curves for overall survival of 337 GC patients in Tianjin cohort. G and H Kaplan–Meier analysis of overall survival according to low and high AR expression in 248 male (G) and in 89 female (H) cases.

