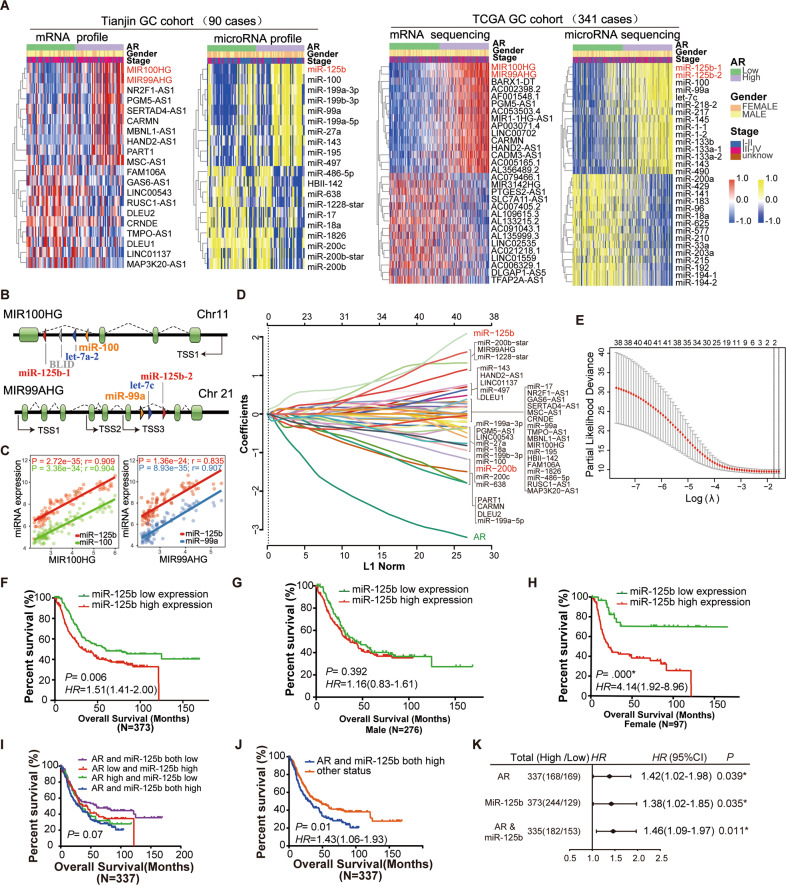
Fig. 2. Identification of key genes associated with AR expression and the prognostic value validation of the AR-related gene set.
A The heatmap shows top significantly up-regulated or down-regulated genes (mRNA and micro-RNA) between AR high and low expression across Tianjin (the two panels on the left) and TCGA (the two panels on the right) GC tumor samples. The red and yellow mean up-regulated mRNA and miRNA, respectively. The blue means down-regulated mRNA and miRNAs. Gene name in red indicates key significant lncRNA and miRNA in both GC datasets. B Diagrams of lncRNA MIR100HG and MIR99AHG gene structure. MIR100HG: the host gene of miR-100/let-7a-2/BLLD/miR-125b-1 cluster on human chromosome 11 (chr11). MIR99AHG: the host gene of miR-99a/let-7c/miR-125b-2 cluster on human chromosome 21 (chr21). C Scatter plots depict the correlation for MIR100HG versus miR-125b or miR-100 (left panel) and MIR99AHG versus miR-125b or miR-99a (right panel) in Tianjin dataset. Scatter plots of expression in TCGA CRC data repository. R: Pearson correlation coefficients. D and E Identification of AR-related gene risk signature for OS by LASSO regression analysis in Tianjin datasets. D LASSO coefficient profiles of the 40 AR expression-associated genes (including lncRNA and miRNAs). The gene name in red indicates the significant gene by the LASSO screening process. The numbers of selected covariates were two for the tuning parameter λ. E Partial likelihood deviance as a function of parameter estimated over a grid of values for λ. A vertical line is drawn at the value chosen by tenfold. F–H Association of expression of miR-125b with gastric cancer survival of 373 cases in Tianjin GC cohorts. F Kaplan–Meier analysis of overall survival according to low and high miR-125b expression in 373 cases. G–H Kaplan–Meier analysis of overall survival according to low and high miR-125b expression in 276 male (G) and 97 female (H) cases. Error bars represent ± SD. I–K Association of expression of AR and miR-125b with gastric cancer survival. I Kaplan–Meier analysis of overall survival in four groups according to low and high AR and miR-125b expression. J Kaplan–Meier analysis of overall survival in two groups according to low and high AR and miR-125b expression. In addition to the group of AR/miR-125b both high expressions, the other three groups in the panel (I) were merged into one group. K Forest plot for the overall survival analysis of AR and/or miR-125b using a multivariable Cox proportional hazards model after adjustment for multiple clinical variables.

