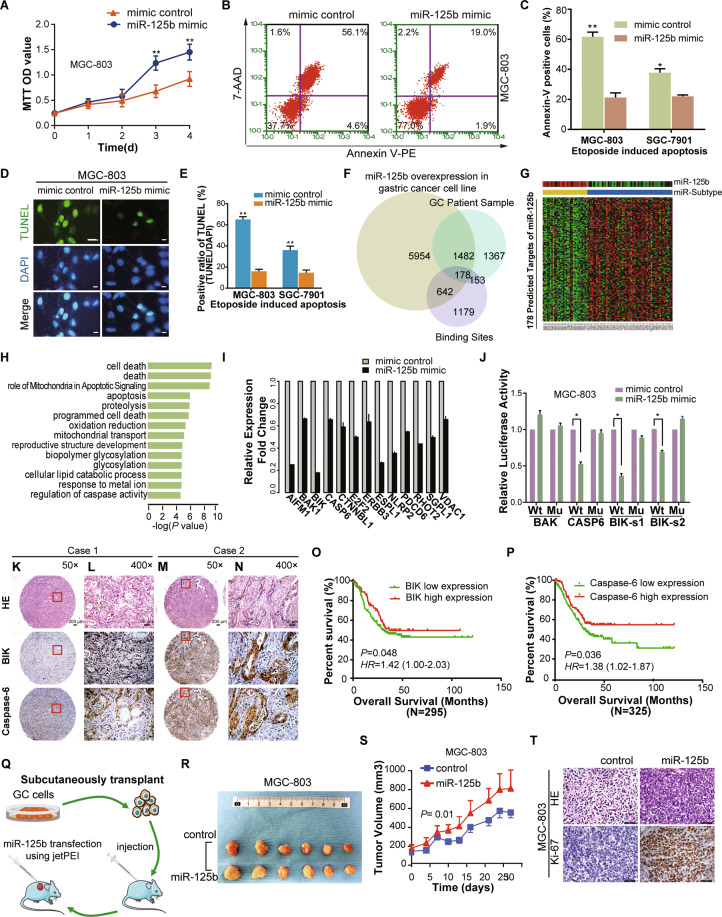
Fig. 4. MiR-125b suppressed cell apoptosis and promoted proliferation in gastric cancer.
A MGC-803 cell lines were transfected with miR-125b mimic or mimic control, and the MTT assay measured cell proliferation. B Representative dot plots of Annexin V/7-AAD staining of MGC-803 cells. After transfected with miR-125b mimic or mimic control for 48 h, the GC cells were incubated for 24 h with 40 μM etoposide. Then GC cells were stained with Annexin V/7-AAD dual staining solutions and detected by flow cytometry (FCM). The apoptotic rate was represented as a percentage of total cell populations. The proportion of early apoptotic cells (Annexin V+/7-AAD-, lower right), late apoptotic/necrotic cells (Annexin V + /7-AAD + , upper right), live cells (Annexin V-/7-AAD-, lower left) and dead cells (Annexin V-/7-AAD + , upper left) were respectively measured for comparison. Values in the images indicate the percentage of each fraction. C The column bar graph showed the Annexin V positive apoptotic cells of flow cytometry data presented in MGC-803 and SGC-7901 cells. The data are presented as mean ± SD of three independent experiments. *P < 0.05 **P < 0.01 indicates a significant difference as compared to the miRNA mimic control group. D and E Identification of late apoptosis by fluorescent TUNEL assay after transfection of miR-125b and mimic control for 48 h and incubated with 40 μM etoposide for 24 h. The stained cells were observed under a fluorescence microscope. The representative images were shown in (E). The Positive cells show a bright green nucleus and DAPI staining was used to show the location of the nucleus. Columns in (E) represent the TUNEL positive cell number in miR-125b and control group. Scale bar = 20 µm (F) A Venn diagram shows the overlap results of integrated analysis dataset (3′-UTR Binding site searching, miR-125b transfected cell line and patient sample dataset), which showed 178 targets of miR-125b. G Heatmap shows the expression of 178 targets. miR-subtype and miR-125b’s expression are shown at the top of the heatmap. H Pathway analysis shows that the predicted targets of miR-125b are highly involved in the apoptosis/program death pathway. I Representative apoptosis genes (e.g., BIK, BAK1, CASP6) are all downregulated after miR-125b transfection. J Effect of miR-125b overexpression on a dual-luciferase reporter plasmid containing the 3′-UTR of candidate target genes (BAK, CASP6, and BIK) was analyzed. The GC cells were co-transfected with either the wild type pMIR-Wt-3′-UTR- BAK/CASP6/BIK (Wt) or corresponding mutant 3′-UTR (Mu) or an empty vector and miR-125b or mimic-control. Firefly and renilla luciferases were measured in the MGC-803 cell lysate. K–N BIK and Caspase-6 protein expression measured by immunohistochemical and HE staining in a tissue microarray (TMA). Immunohistochemical analysis on consecutive tissue microarray slides of GC tissues showed different expression of BIK and Caspase-6 in GC patient. Representative case 1 had low expression of BIK and Caspase-6 (K and L, respectively). Representative Case 2 represented a high expression of BIK and Caspase-6 (M and N, respectively). Scale bars, 200 μm (K and M) and 50 μm (L and N), respectively. O–P Kaplan–Meier overall survival curves according to low and high BIK (O) and Caspase-6 (P) protein expression in 295 and 325 cases, respectively. Green and red lines represent low and high protein expression, respectively. Q Schematic representation of miR-125b transfection experiment using xenografted MGC-803 and SGC-7901 nude mice model. R Representative images of tumor sizes in control and miR-125b treated mice from MGC-803 cells. S In vivo xenograft tumor growth curve of MGC-803 cells expressing control and miR-125, error bars represent ± SEM. T the representative images of HE and Ki-67 staining of MGC-803 xenograft tumors after 4 weeks of miR-125b and control in vivo transfection. Scale bar = 50 µm.

