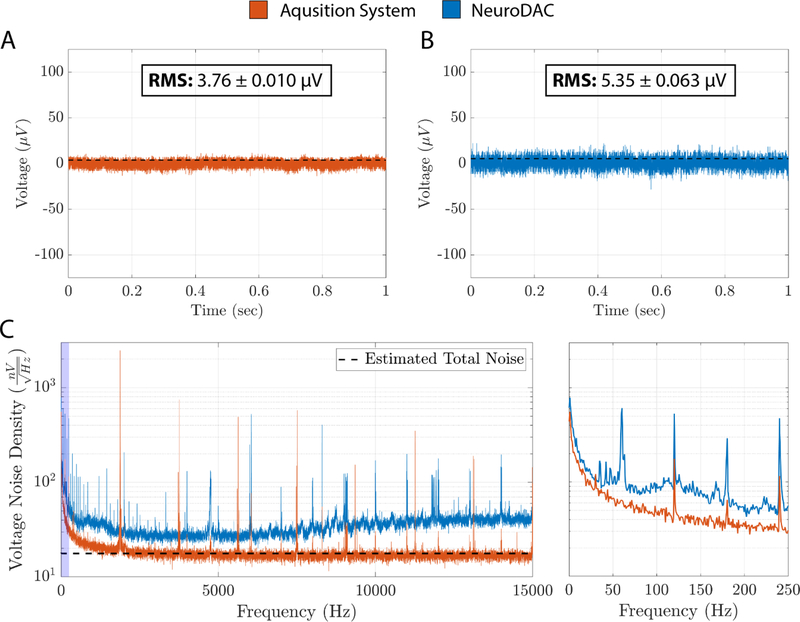
Figure 4.
(A) A raw 1 second example trace of the Intan RHD2132 amplifier and OpenEphys data acquisition system noise floor [42]. Mean RMS noise floor (± std.) for all 5, 10 second long, recordings is overlayed as a dotted black line. (B) A raw 1 second example trace of the NeuroDAC noise floor recorded through the Intan/OpenEphys acquisition system. Mean RMS noise floor (± std.) for all 5, 10 second long, recordings is overlayed as a dotted black line. (C) A comparison of the estimated noise floor density between the data acquisition system with and without the NeuroDAC attached. The theoretical estimation of the noise density is given as a black dotted line. An expanded view of the frequency range from 0 to 250 Hz (blue highlighted region) is shown on the right.

