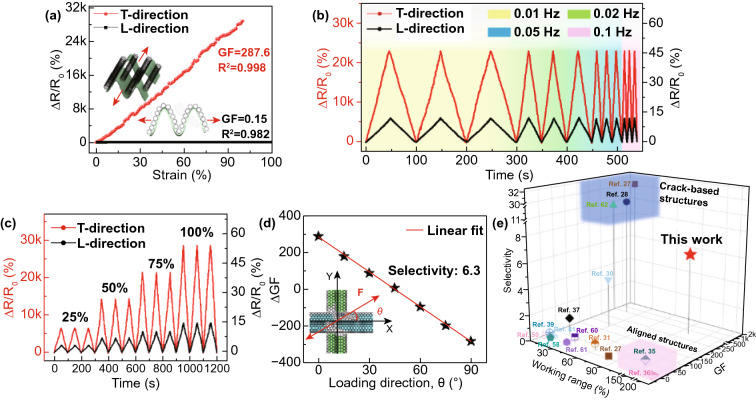
Fig. 4.
Anisotropic sensing performance of the sensor. a Relative resistance changes as a function of strain in L- and T-directions. b Relative resistance changes under 80% strain at different frequencies. c Relative resistance changes under repeated cycles at different strains. d Selectivity calculated from the linear fit of ΔGF versus loading direction data. e Comparison of GF, selectivity, and working range with existing anisotropic strain sensors in the literature. The highlighted blue and pink regions represent sensors with crack-based and aligned structures, respectively

