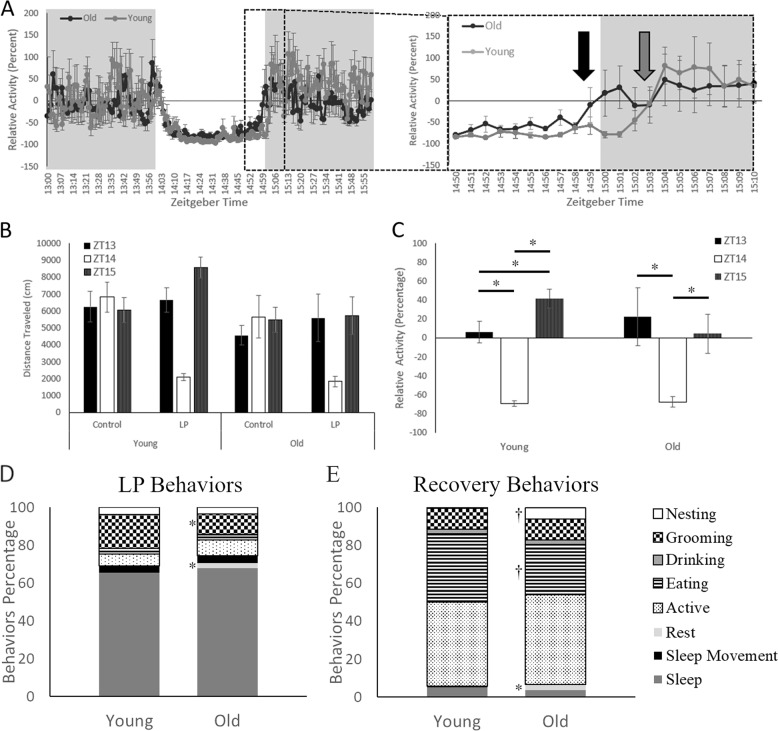
Fig. 4. The masking effects of nighttime light exposure given at ZT14 between the age groups.
A A plot of before, during, and after the masking pulse spanning three hours of activity in one-minute bins (Left Panel). The gray area indicates the hours before and after the light pulse (LP), while the white indicates light exposure. The inlet highlights the transition period 10 min before and after the return to darkness as animals return to baseline activity levels (Right Panel). Young animals in light gray recover from the LP after being returned to darkness (Gray Arrow) while the older animals in black do not sustain activity the entirety of the LP (Black Arrow). B Activity for animals plotted at the hour level on a control day, where no LP is given, did not differ across the 3 h between either young or old animals. However, both ages had dramatic differences in activity levels on the LP day. C Statistical comparisons of activity levels, corrected to control day levels as a relative percentage, indicate significant suppression of activity during LP and heightened recovery levels in young mice at ZT15. D and E Video analysis during LP (D) and Recovery (E) demonstrated alterations in time spent engaging in different behaviors between the age groups. Resting was significantly greater for older animals during both times, while grooming was reduced only during the LP. Old animals also had a trend in significance for higher nesting and lower eating levels during recovery. *<0.05, †p < 0.1.

