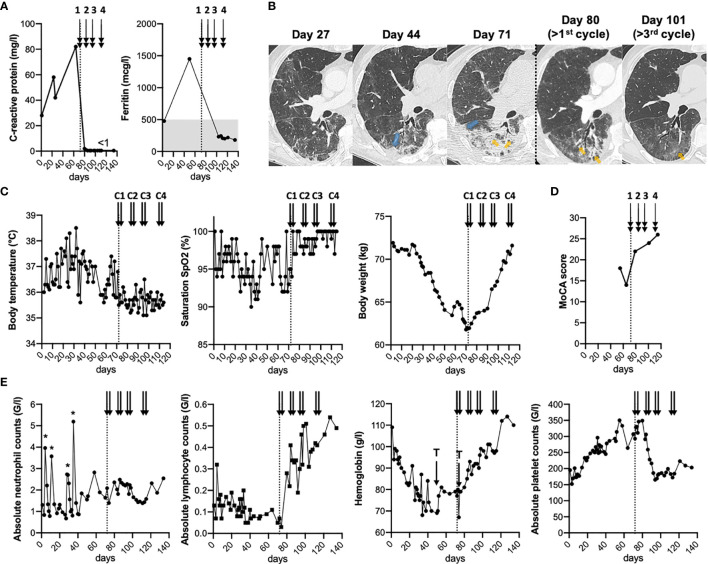
Figure 1.
Clinical, biological and radiological follow-up before and after plasma transfusions. (A–E), Timeline of chronic SARS-COV-2 infection in a severely immunosuppressed patient showing inflammatory markers (A), chest CT scan (B), clinical parameters (C), MoCA (Montreal Cognitive Assessment) scores (D), and complete blood counts (E). (B), Axial slices focused at the level of the apical segment of the right lower lobe. Progressive worsening from multiple ill-defined areas of ground glass opacities progressing to patchy alveolar consolidation of increasing size. Note the subpleural (blue arrows) and peribronchial (orange arrows) distribution of the lesions with progressive improvement on post-therapeutic follow-up, alveolar consolidation being replaced by ground glass opacity. (A–E), Arrows indicate the 4 cycles of plasma transfusion (two units given on two consecutive days of each cycle). The “*” show the three injections of granulocyte-colony stimulating factor (filgrastim), while “T” indicates the two red blood cell transfusions. Of note, filgrastim injections (< day 40) and red blood cell transfusions did not result in symptom improvements.

