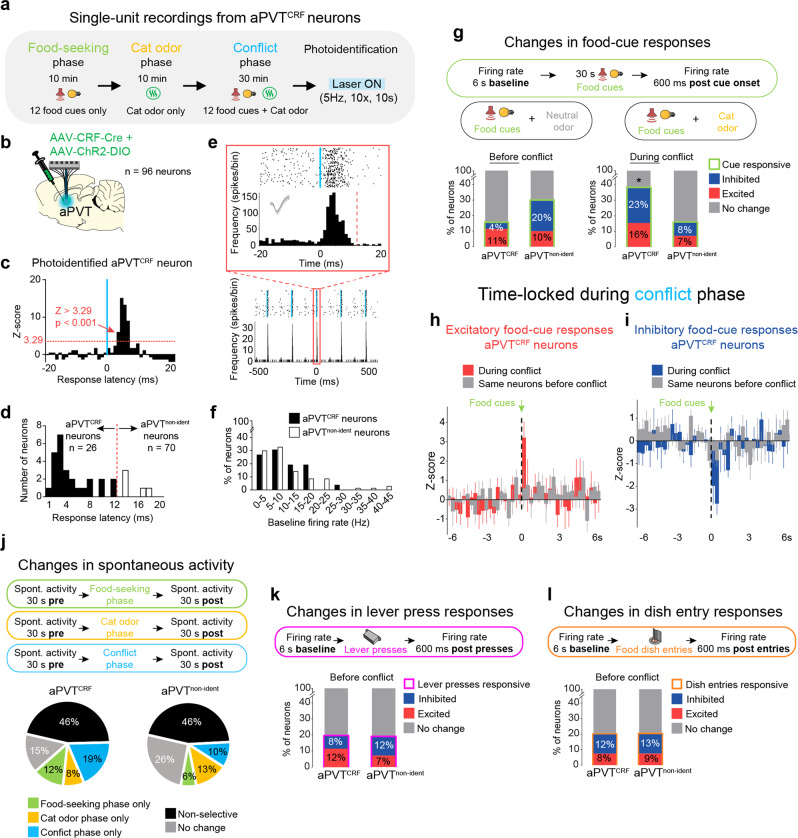
Fig. 4. aPVTCRF neurons are recruited during the approach-avoidance conflict test.
a Timeline of the approach-avoidance conflict test during single-unit recordings from photoidentified aPVTCRF neurons. b Diagram showing the injection of viral mix containing AAV-CRF-Cre and AAV-ChR2-DIO, and the implantation of optrode in aPVT. c–e Photoidentification of aPVTCRF neurons. c Representative aPVTCRF neuron responsive to laser illumination (Z-score >3.29, P < 0.001, red dotted line, see details in Methods). d Cells with photoresponse latencies <12 ms were classified as aPVTCRF neurons (black bars, n = 26 out of 96 recorded neurons), whereas cells with photoresponse latencies >12 ms (white bars, n = 5 neurons) or non-responsive to the laser (n = 65 neurons, not shown) were classified as non-identified aPVT neurons (aPVTnon-ident, n = 70 out of 96 recorded neurons). e Raster plot and firing rate of a representative aPVTCRF neuron responding to a 5 Hz train of laser stimulation. Inset: Raster plot and firing rate time-locked for laser onset. Vertical blue bars: laser onset. Bins of 1 ms. f Relative frequency histogram showing the baseline firing rate of aPVTCRF neurons and aPVTnon-identif neurons. g (Top) Schematic of the food-cue-evoked responses. (Bottom) Percentage of aPVTCRF and aPVTnon-ident neurons that were responsive to food cues (green bars) before (left) and during the conflict (right). aPVTCRF neurons showed more food-cue responses during the conflict test, when compared to aPVTnon-ident neurons (Fisher’s exact test; aPVTCRF neurons: 39%, 10 out of 26; aPVTnon-ident neurons: 15%, 11 out of 70 neurons, P = 0.039). h–i Average peristimulus time histograms of all photoidentified aPVTCRF neurons showing h excitatory or i inhibitory food-cue responses during the conflict (red or blue bars, respectively) or the same neurons before the conflict (gray bars). j (Top) Schematic of the spontaneous activity recordings. (Bottom) Percentage of aPVTCRF and aPVTnon-ident neurons that changed their baseline spontaneous activity (30 s pre vs. 30 s post) exclusively in food-seeking phase, cat odor phase, conflict phase (30 min), in more than one phase (nonselective), or did not change. No differences were observed between the two groups (Fisher’s exact test, all P’s > 0.05). k (Top) Schematic of the recordings during lever presses-evoked responses. (Bottom) Percentage of aPVTCRF and aPVTnon-ident neurons that were responsive to lever presses (pink bars) before the conflict phase. l (Top) Schematic of the recordings during dish-entry-evoked responses. (Bottom) Percentage of aPVTCRF and aPVTnon-ident neurons that were responsive to rewarded dish entries (orange bars) before the conflict phase. No differences were observed between the two groups (Fisher’s exact test, all P’s > 0.05). A total of eight rats were used.

