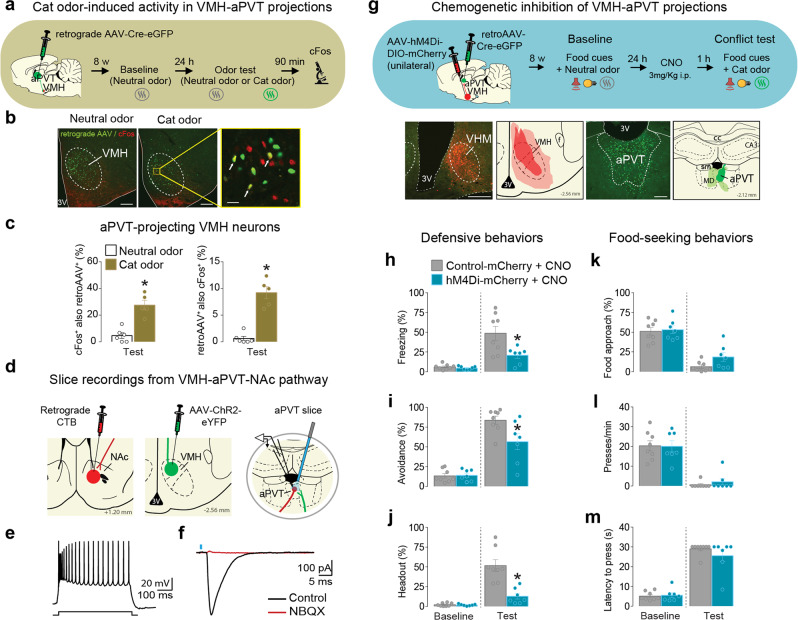
Fig. 9. Chemogenetic inhibition of VMH-aPVT neurons attenuates defensive behaviors during the conflict test.
a–c Cat odor exposure activated VMH-aPVT neurons. a Timeline of the cat odor-induced neuronal activity test. b Representative micrographs showing VMH-aPVT neurons (green) expressing immunoreactivity to cFos (red) in both neutral odor (left) or cat odor (right) groups. Inset: white arrows showing examples of co-labeled cells. c Cat odor exposure (brown bars, n = 5) significantly increased (left) the percentage of VMH-aPVT cells that were cFos-positive and (right) the percentage of cFos-positive cells that were aPVT projecting, when compared to neutral odor controls (white bars, n = 6; unpaired Student’s t test; left, P < 0.001, t = 7.64; right, P < 0.001, t = 5.78). d–f Photoactivation of VMH afferents induces monosynaptic EPSCs in NAc-projecting aPVT neurons in vitro. d Schematics showing CTB infusion in NAc, viral vector AAV-ChR2-eYFP infusion in VMH, and slice recordings from NAc-projecting aPVT neurons. e Action potentials evoked by a depolarizing current step in a NAc-projecting aPVT neuron. f For the same cell, optically evoked EPSC (black) was completely blocked following bath application of the AMPA receptor antagonist NBQX (red). Similar findings were made in nine additional neurons (two rats). g (Top) Timeline of the conflict test during chemogenetic inhibition of VMH-aPVT neurons. (Bottom left) Representative micrograph showing the unilateral expression of hM4Di in VMH. (Bottom left-center) Red areas represent the minimum (dark) and the maximum (light) viral expression. (Bottom right-center) Representative micrograph showing the expression of retrograde AAV-Cre-GFP in aPVT. (Bottom right) Green areas represent the minimum (dark) and the maximum (light) viral expression. h–m Chemogenetic inhibition of VMH-aPVT neurons (blue bars, n = 7) reduced the percentage of time rats spent exhibiting h freezing (F(1, 13) = 7.35, P = 0.017), i avoidance (F(1, 13) = 4.59, P = 0.051 with Bonferroni planned comparison test P = 0.005) and j head-out responses (F(1, 13) = 18.64, P < 0.001). No changes were observed in k food-approach time (F(1, 13) = 0.92, P = 0.35), l lever press (F(1, 13) = 0.18, P = 0.67) and m latency to press (F(1, 13) = 1.26, P = 0.28) during the conflict test, when compared to mCherry controls (gray bars, n = 8). 3V third ventricle, f fornix, sm stria medullaris, cc corpus callosum, MD mediodorsal thalamus, CA3 hippocampal CA3 subregion. Scale bars: 200 μm; inset scale bar: 25 μm. Two-way repeated-measures ANOVA followed by Bonferroni post hoc test. Data are shown as mean ± SEM. *P < 0.05. See also Supplementary Movie 9.

