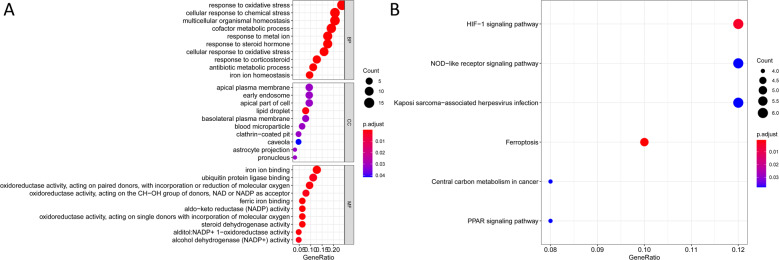
Fig. 1. Gene ontology (GO) and Kyoto Encyclopedia of Genes and Genomes (KEGG) outcomes of ferroptosis-related genes through the R language “ggplot2” and “org.Hs.eg.db” package (adjust p value <0.05).
The org.Hs.eg.db package implements the conversion between gene symbols and entrezIDs based on mget function. The X-axis represents the gene ratio, that is, the number of genes enriched in each GO/the total number of genes and the Y-axis represents the specific function or pathway that is enriched. The size of the circle represents the number of genes enriched on each GO, and the redder the color represents the higher the degree of enrichment on GO. A GO; B KEGG. (BP: biological processes, MF: molecular functions, CC: cellular components).

