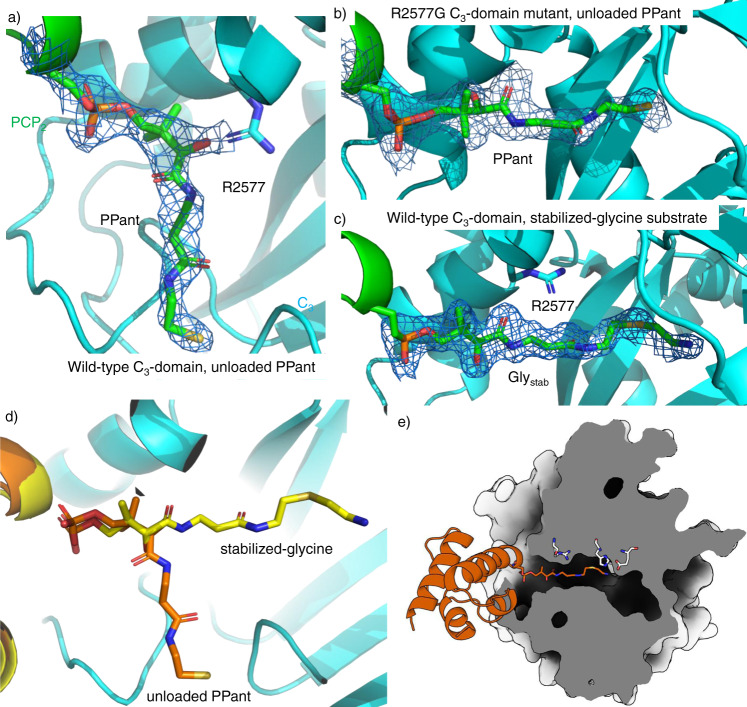
Fig. 4. PCP2-C3 interaction interfaces showing the differences in substrate acceptance.
a Structure of WT C3 domain with unloaded PPant (7KVW), showing the PPant not extending into the C3-domain as the side chain of R2577 prevents the PPant accessing the C3-domain active site. b Structure of R2577G C3 domain with an unloaded PPant (7KW2), showing the PPant fully extended into the C3-domain catalytic channel. c Structure of WT C3 domain where the PPant is loaded with a Glystab substrate (7KW0), rotated 90° anticlockwise compared to panels (a) and (b). Here, PPant-Glystab extends fully into the catalytic channel. d Comparison of the positioning of the unloaded PPant (orange) and PPant-Glystab (yellow) within the C3 domain. e Cutaway representation of the C3 domain indicating the path of the PPant-Glystab substrate from the PCP2 domain (shown in orange). All densities shown as 2Fo-Fc maps, contoured at 1σ and using a carve value of 1.8 Å.

