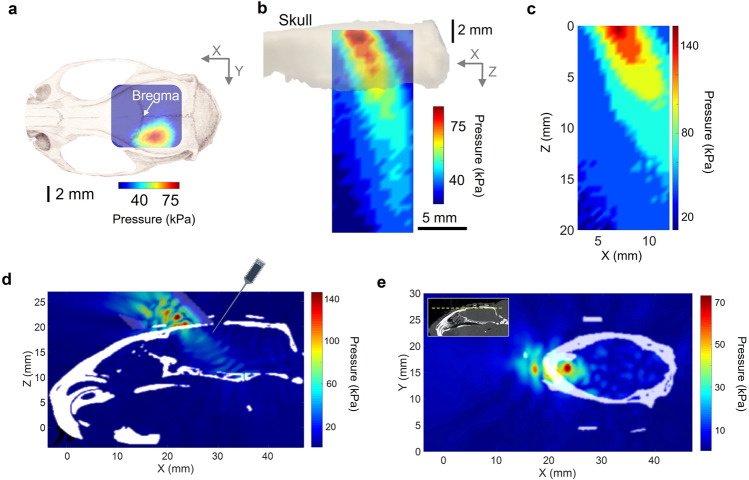
Fig. 2. The characterizations of the tFUS pressure fields.
a, b One transverse (X–Y plane) and one sagittal (X–Z plane) scans of ultrasound pressure distribution under the cranium using a hydrophone-based US field mapping system. After penetrating through the ex vivo skull top, spatial-peak ultrasound pressure is measured as 79 kPa. The ultrasound intensities are listed in Tables 1 and 2. c A sagittal (X–Z plane) view of ultrasound pressure distribution in the free water without the cranial bone. The ultrasound setup, including the use of collimator and incidence angle, were the same as depicted in Fig. 1a. The spatial-peak ultrasound pressure is measured as 148 kPa. d A 3D computer simulation investigating the quantitative maximum pressure distribution at one sagittal i.e., X–Z plane inside the rat skull (in white) when the tFUS is guided by a 3D-printed collimator (see Methods) and directed to the S1 with an incidence angle of 40°. As illustrated, the intracranial electrode array is inserted into the brain via the cranial burr hole. e A transverse (X–Y plane) view of computer simulated ultrasound pressure field. The yellow dashed line shown in the inset indicates the location of the presented transverse plane.

