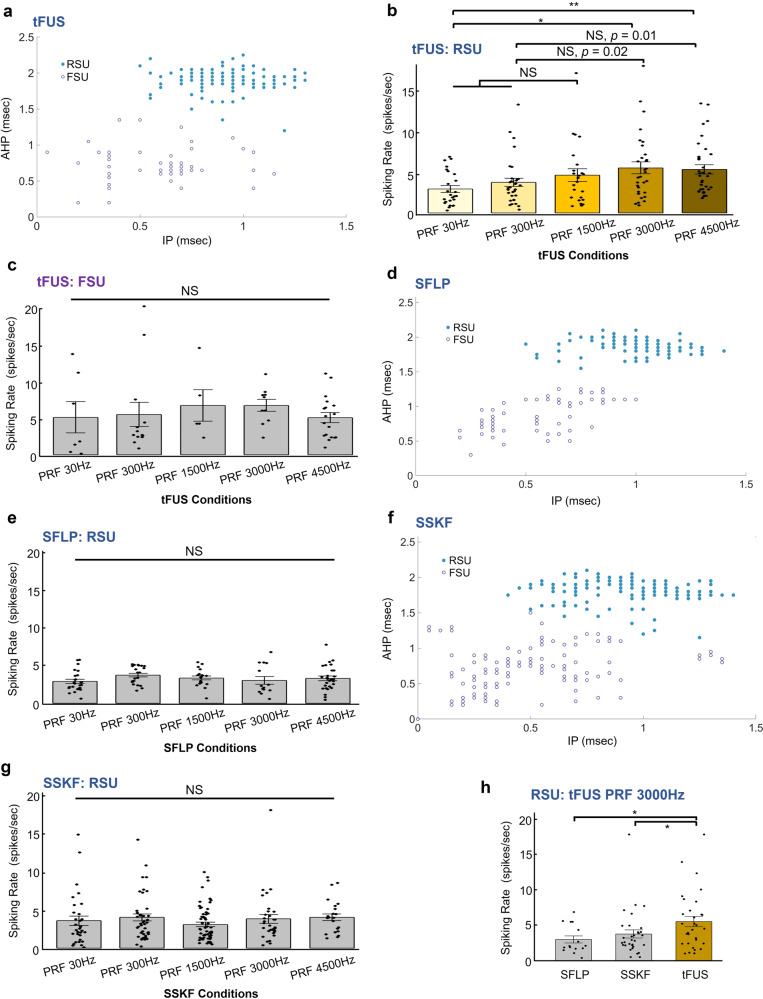
Fig. 4. Cell-type-selective responses to tFUS and sham ultrasound conditions.
The ultrasound parameters listed in Table 1 were used in this study. a k-means cluster classification of 199 single units with blue solid circles depicting the RSUs while purple circles representing the FSUs. The majority was classified as the RSUs with longer IP and/or AHP durations than the FSUs. These spiking units were recorded and identified under the influence of the administered anesthesia (xylazine) and analgesic drugs (ketamine), in which the durations of both IP and AHP are observed to be longer than the results reported in literature56,95 for different sedative approaches. b The 146 RSUs showed significantly different responses to different tFUS conditions (Kruskal–Wallis chi-squared = 14.45, p = 0.006). Data are shown as the mean±s.e.m., with statistical comparisons made through Kruskal–Wallis two-sided one-way ANOVA on ranks and post hoc one-tail two-sample Wilcoxon tests with Bonferroni correction for multiple comparisons (PRF 30 Hz vs. PRF 3000 Hz: p = 0.003; PRF 30 Hz vs. PRF 4500 Hz: p = 0.0004). *p < 0.005, **p < 0.001. NS, not significant. s.e.m., standard error of mean. c The FSU group, which consisted of fewer neurons (N = 53, marked as purple hollow circles), was observed to have a higher mean spike rate than RSUs, whereas this FSU group showed no significant effect by different PRF levels. Data are shown as the mean±s.e.m., statistics by Kruskal–Wallis two-sided H-test. d, e In one of the sham conditions, i.e., SFLP, the cluster analysis for another identified 179 single units. d 110 RSUs and 69 FSUs were separated. e RSUs (n = 110) showed homogeneous lack of response to the SFLP conditions. No significant effect of the ultrasound conditions was observed through statistics by Kruskal–Wallis two-sided H-test. Data are shown as the mean ± s.e.m. NS, not significant. s.e.m., standard error of mean. f, g In another sham control, i.e., SSKF, for investigating any potential effects of bone-conduction, the cluster analysis for another identified 311 single units. f 192 RSUs and 119 FSUs were separated. g RSUs (n = 192) also showed a homogeneous lack of response to the SSKF sham ultrasound conditions. No significant effect of the ultrasound conditions was observed through statistics by Kruskal–Wallis two-sided H-test. NS, not significant. s.e.m., standard error of mean. h Group comparisons between SFLP (n = 15) and tFUS (n = 31), and between SSKF (n = 32) and tFUS conditions regarding RSUs’ spiking rates responding to the PRF 3000 Hz level (tFUS vs. SFLP: p = 0.033; tFUS vs. SSKF: p = 0.048). Data are shown as the mean ± s.e.m., statistics by two-tail Wilcoxon test. *p < 0.05. Source data are provided in the Source Data file.

